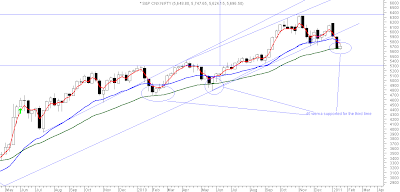
Weekly Chart
Positives are that the support line shown in red gave good support and the close was once again above the trendline joining tops since August 2010. OBV continues to show positive divergence.The 40 wema has proved good support for the third time in the March 2009 rally.
Negatives are that oscillators continue looking weak.This fall has been the biggest fall of the March 2009 rally raising doubts whether it is a reversal of the uptrend. Laboured recoveries are no match to the desperate falls.
Till we see more bullish candles on good volumes recovery will be suspect.In other words stay light and hedged .
Daily Chart
The daily candle was a "spinning top" showing losing momentum on the downside. It formed an "Inside day" pattern as the high of 5729 and low of 5634 of the previous candle could not be broken.If an inside day is found at the end of a prolonged downtrend ( already 10 weeks old) and is located near a level of support ( which it is --just bounced off the 200dema and the 40wema ), it can be used to signal a bullish shift in trend.
As per candlestick analysis this formation is called a Harami.The significance of a Harami is that it tells us that the selling has stopped. The close of the Harami can help predict how strong the new trend will be. If the Harami opens and closes at the very low end of the previous day's candle, the new uptrend may be very flat or slow. An open and close midway into the previous candle, will set a moderately strong upmove. The uptrend may be very strong if the harami opens and closes near the top of the previous day's candle.
In Nifty's case the harami is midway into the previous day's candle indicating a mildly bullish rally may ensue. This is in keeping with the fact that a medium term downtrend is in place.Oscillators too have failed to show any enthusiasm.
Half Hourly Chart
The half hourly chart shows a coiling effect in the form of an equilateral triangle.Failure to scale above the red neckline keeps the possibility of the target of 5230 being attempted. The weekly and daily on the other hand show attempts of stalling the fall. This conflict is rightly depicted by the equilateral triangle which signifies indecision.
My View
The fall is getting old and thus the energy to run down is failing. Attempts of a rally should be traded cautiously as a downtrend is in place and Nifty has to give more bullish signals for a trend reversal.Trade light and hedged in the direction of breakout from the equilateral triangle .
Resistance on daily for the triangle is at 5701 and Support at 5641.
follow me on twitter http://twitter.com/#!/lucksr
Happy Trading !!
Lakshmi Ramachandran
www.vipreetsafetrading.com


No comments:
Post a Comment