Om Sri Ganeshaya Namaha

Om  Sri  Ganeshaya  Namaha
follow me on twitter http://twitter.com/#!/lucksr

Wednesday, March 31, 2010

Reigning The Nifty - 1st April , 2010


Daily Chart


Half Hourly Chart


A lower high and lower low candle breaching yesterday's low , but only intra day, leaving one guessing if the fall will continue.Improving breadth  since last two days makes the guessing more difficult. Volumes were higher than the previous two days. Daily oscillators are weak and moving down  towards neutral zone.
Half hourly stochastic oscillator has reached oversold zone. Rsi 14  has reached levels where it has taken support at levels maintained since 15th March. Nifty has bounced back twice  from these levels . Will it do so a thrid time? The fall has formed a falling wedge which is a bullish formation. Watch for support on the lower trendline of the wedge as this may lead to a breakout from the wedge.

Strong supports are at 5187-5175. Remaining neutral would be the strategy.

Since tomorrow is the last trading day of the week, would prefer to analyse the monthly and quarterly charts during the weekend.


Happy Trading !!

Lakshmi Ramachandran
www.vipreetsafetrading.com

Tuesday, March 30, 2010

Reigning The Nifty - 31st March, 2010


Daily Chart


Daily Chart II


Sensex


Half Hourly Chart


  • Inside day which is indecision, but the bearish candle almost engulfing of yesterday's real body shows a bearish bias.
  • Daily oscillators are moving down from overbought area after showing negative divergence and half hourly oscillators are showing weakness. 
  • Strong support at 5187  to 5175 .
Today was the first day which witnessed selling and ended at the low. I had called for caution since last few days on weakening internals of the market .The Nifty is still to make a lower low , so the bias is still up and shorting the market could still be risky.However the Sensex has made a lower high and lower low. Remaining neutral till there is more more clarity of direction, would be wise.

Happy Trading !!

Lakshmi Ramachandran
www.vipreetsafetrading.com

Monday, March 29, 2010

Reigning The Nifty - 30th March, 2010


Daily Chart


Half Hourly Chart


  • Wide ranging candle ending with a small white body depicting confused markets.
  • Previous high of 5310 was crossed intra day, but could not close above it
  • Daily and intra day oscillators are in negative divergence.
  • Breadth was negative once again driving the advance decline line to new lows.
Market internals are deteriorating making one cautious inspite of the continuing upmove. Keep a stop loss of 5250 on longs and remain neutral if not in the market.


Happy Trading !!

Lakshmi Ramachandran
www.vipreetsafetrading.com

Sunday, March 28, 2010

Reigning The Nifty - 29th March, 2010


Weekly Chart


Daily Chart


Half Hourly Chart


Weekly Charts 
  • A higher high higher low maintained for the sixth week but on very low volumes.
  • Doji showing indecision the long lower shadow shows support at lows.
  • Macd and Rsi 14 continue to be in negative divergence.Macd has moved  towards it's signal line and about to give a buy after giving a sell on week ending 30th October 2009.
  •  
    Daily Charts
    • Close exactly at high made on line charts on the 6th of Jan .
    • Rsi and stochastics in overbought region and stochastics still in negative divergence.


    Half Hourly Charts
    • Moving averages bullishly aligned.
    • Oscillators continue to show negative divergence.

    Nifty has continued to move up but on lower volumes , deteriorating breadth and  negative divergences , all calling for caution. Trend following indicators are strong and price patterns too call for a continued uptrend. A classic breakout from the downtrendline joining January 2008 and Januray 2010 highs, a retest of the trendline and continuing to move up  supports this view.  However deterioration of market internals calls for caution.

    Strategy of remaining neutral saved one from  whipsaws. Remain neutral till a decisive break above the high of  5310.If one is still long then stops should be at 5250 to protect profits. Crucial support for longs is at 5187.


    Happy Trading !!

    Lakshmi Ramachandran
    www.vipreetsafetrading.com

    Thursday, March 25, 2010

    Reigning The Nifty - 26th March, 2010


    Daily Chart


    Half Hourly Chart

    • Bullish candle on high volumes which broke above the inside day range but could not manage a close above it.
    • Breadth was negative leading the advance decline line to move lower which is a negative .
    • Stochastics and Rsi 14 are overbought on daily charts.
    • Intraday oscillators are in neutral zone after giving a positive divergence.
    • Breakout above down trendline joining Jan 2008 and Jan 2010 highs which is a positive.
    The break from the rising wedge seems to have led to a sideways correction.Only a break above the high of 5310 will set the momentum for further upsides.A break of 5187 on the lower side will lead to further downsides. Meanwhile being neutral would be the startegy.


    Happy Trading !!

    Lakshmi Ramachandran
    www.vipreetsafetrading.com

    Wednesday, March 24, 2010

    Reigning The Nifty - 25th March, 2010


     Daily Chart


    Daily Chart II


     Half Hourly Chart


    • An "Inside day" which signifies indecisiveness.
    • Nifty  above trendline joining Jan 2008 and Jan 2010 highs since 17th March .
    • Nifty has broken out of the falling wedge shown on intra day charts.
    • Positive divergence on half hourly charts. Macd has given a buy once again after giving a sell on 17th March at 3pm.
    • Break below rising wedge maintained.
    • Daily oscillators --stochastics moving down after negative divergence and macd moving towards it's signal line.
     Bears failed to follow up on selling leading to confusion of short term traders.The inside day upper limit is at 5260 and lower limit is at 5187. Break on either side should give us the direction for trade.Being neutral till further clarification would be prudent.

    Happy Trading !!

    Lakshmi Ramachandran
    www.vipreetsafetrading.com

    Monday, March 22, 2010

    Reigning The Nifty - 23rd March, 2010


     Daily Chart


    Daily Chart II


    Half Hourly Chart


    "Rising wedge along  with negative divergence on half hourly charts makes one cautious. Breadth continues to be a concern to the continuation of the up move. Multiple resistances around  the 5300 mark". 

    Paying heed to caution  and maintaining stops certainly paid off. The Nifty  made a  Big bearish candle wiping out the gains of the last two days and just managed to close above the low of 5177  of  the candle of last thursday . It  also broke down from the rising wedge.The rising wedge was of the height of 437 points. Target comes to 4784. The daily stochastics is moving down after giving a negative divergence.

    Retraced 50 % of rise from 5101 to 5270. Supports are at  5101-5000-4833-4675. Refer daily chart II.

    Maintaining above the down trendline from Jan 2008 highs could see the Nifty reach higher highs.


    Happy Trading !!

    Lakshmi Ramachandran
    www.vipreetsafetrading.com

    Saturday, March 20, 2010

    Reigning The Nifty - 22nd March, 2010


    Weekly Chart


    Daily Chart


    Half Hourly Chart


    Weekly
    • Weekly still bullish with sixth consecutive weekly rise. 
    • Volumes were low for the week.
    • Breadth was negative.
    • Maintained within the rising channel.
    • Stochastics in overbought region, RSI  moving in tandem with the Nifty, Macd in sell above zero line.
     Daily
    • Steep rising wedge  which is a bearish pattern.
    • Oscillators in overbought region.
    Intra Day 
    • Rising wedge shown in red.
    • Negative divergence on oscillators.
    The uptrend continues. Rising wedge along  with negative divergence on half hourly charts makes one cautious. Breadth continues to be a concern to the continuation of the up move. Multiple resistances around  the 5300 mark.

    Continue longs with a strict stop around 5221-5214 level.


    Happy Trading !!

    Lakshmi Ramachandran
    www.vipreetsafetrading.com

    Thursday, March 18, 2010

    Reigning The Nifty - 19th March, 2010


    Daily Chart


    Daily Chart II


     Half Hourly Chart 


    • Inside day--indecisive day of trading, but maintained the breakout from the channel.
    • Breakout from bullish flag  shown on intraday charts.Pole of the flag measures  5260-5123=140 points. That gives a target of  5242+140=5380.
    • Falling wedge target is 5422.
    • Strong resistances around the 5300 levels shown on Daily Chart II.

    Bullish breakout gives weight to the continuing of the uptrend. Inside day questions the continuation of the uptrend , requesting a break of the high of yesterday at 5260.Advance Decline line reiterates this point of view. Oscillators are strong and reached oversold zone on daily charts.The uptrend seems to have taken the shape of a rising wedge, shown on daily chart II, which is a bearish pattern


    Booking partial profits would be a good idea and keep a stop loss of 5200 on longs.


    Happy Trading !!

    Lakshmi Ramachandran
    www.vipreetsafetrading.com
    Reigning The Nifty - 18th March, 2010


    Daily Chart


    Daily Chart II


     Half Hourly Chart


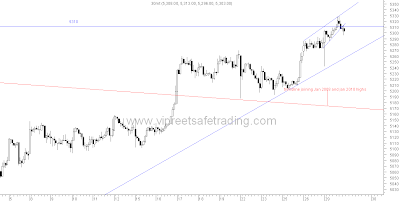
    A bullish day with a little profit booking at the highs and buying at the lows, reminding one of  the greater fool theory. I booked out of 75% of my longs deciding to pocket some money and feel good. 

    Nifty is nearing it's earlier high of 5310 and the lower trendline of  the rising wedge it broke down from on the 27th of January , which offers resistance tomorrow at 5292. This may not be too easy to scale. The advance decline line too continues to remain negative not keeping up with the Nifty which is moving higher.

    Nifty must remain above 5215 to continue the upmove else it will  fall back into the upward rising channel from which it broke out  today. Today's intraday correction took support exactly at the 23.6% retracement level of rise from 5100.Fresh longs should be ventured into only when this correction proves itself to be a consolidation and not a distribution.

    Trend is up and one should only  be long. Stop loss at 5180.


    Happy Trading !!

    Lakshmi Ramachandran
    www.vipreetsafetrading.com

    Tuesday, March 16, 2010

    Reigning The Nifty - 17th March, 2010


    Daily Chart


    Daily Line chart

    Half Hourly Chart

    A Huge bullish candle after a series of  near doji candles, retracing more than 80% of the fall, which resisted exactly on the upper trendline joining  the tops made in the rise from 4675..Breadth too was positive.The only negative point was the low volumes

    In my post for the 11th of March , I had written, " Obv has crossed the previous peak indicating Nifty could cross it's peak made at 5310". The Nifty seems to be  behaving exactly on lines of the OBV and  moving towards 5310. The 261.8% retracement of fall from 5158 to 5101, shown on half hourly charts may prove a barrier at 5250.

    I am posting the Daily Line charts once again,  showing the falling wedge target of 5422 , which I had earlier mentioned in my post for 2nd March. If the top of 5310 is scaled , Nifty could move towards this target.

    The Nifty has built a good base around  5092-5100  levels. This should serve as a good stop loss for longs.

    Happy Trading !!

    Lakshmi Ramachandran
    www.vipreetsafetrading.com

    Monday, March 15, 2010

    Reigning The Nifty - 16th March, 2010


    Daily Chart


    Half Hourly Chart


    • Sideways movement continues but bias was changed to 'down' today .
    • Doji  second day in a row with lower high and lower low.
    • Advance Decline negative since 9th March.
    • A bearish head and shoulder formation on the 30 minute charts. Break of neckline around 5100 will give a target around 5045 which coincides with the 23.6% retracement of rise from 4675.
    The first sign of weakness would be break of 5100. Keep your stop at this level for existing longs.Longs with a slightly longer term view could wait for a break of the uptrendline from 4675.

    Happy Trading !!

    Lakshmi Ramachandran
    www.vipreetsafetrading.com

    Reigning The Nifty - 15th March, 2010

    Weekly Chart


    Daily Chart

     Half Hourly Chart


    Just a short writeup as I am just back from a weekend trip to Mumbai.

    Fifth consecutive week of upmove. Volumes were low for the week.Weekly stochastics has reached oversold zone so we may watch it for turning weak. Rsi and macd are still strong. Still within the channel. New uptrendline from low of 4675 gives support at 4900. This level coincides with the 50% retracement level of the entire rise from 4675, at 4917.

    Daily and half hourly charts have nothing new to say since the move has been sideways with a slight upward bias.

    Trend up so be long with a stop loss of 5092 and longs with a slightly longer term view could wait for a break of the uptrendline from 4675.


    Happy Trading !!

    Lakshmi Ramachandran
    www.vipreetsafetrading.com

    Thursday, March 11, 2010

    Reigning The Nifty - 12th March, 2010

     Daily Chart


    Half Hourly Charts


    Nifty made a higher high higher low and broke the range of last few days but could not close above it's high of 5147. The trend is still up and longs need to keep a stop loss of  5092.


    Happy Trading !!

    Lakshmi Ramachandran
    www.vipreetsafetrading.com

    Wednesday, March 10, 2010

    Reigning The Nifty - 11th March, 2010


    Daily Chart


    Daily Line Chart


    Half Hourly Chart


    • Inside day range of 5092-5147 not broken, but an outside day occured,  which is bearish. An outside day is when the day's candle completely encompasses the previous day's candle. It must have a higher high than the previous day and a lower low than the previous day.A bigger range though would have been more emphatic about trend change.
    • Consolidation/distribution has formed an equilateral triangle which is visible in half hourly charts.
    • Daily oscillators giving mixed signals- stochastics in sell and has moved below 80 level, Rsi14 above 50 line but not showing strength enough to move into overbought region, macd is moving up above zero lin in buy mode.
    • Half hourly oscillators show continued weakness.
    • All moving averages are bullishly aligned on the daily charts.
    • Obv has crossed the previous peak indicating Nifty could cross it's peak made at 5310. 
    Markets are  giving mixed signals. New longs taken on the break of the flag formation would have been caught on the wrong foot with a false breakout , only to turn up once again.Look for short term direction on break of 5147 -5092 range.

    The trend however is up . So continue longs  with a stop loss of 5050 . Longs with a longer term view should wait for a break of the uptrendline from 4675. New longs to be taken only if breaks out of the triangle on the upside.


    Happy Trading !!

    Lakshmi Ramachandran
    www.vipreetsafetrading.com

    Tuesday, March 9, 2010

    Reigning The Nifty - 10th March, 2010


    Daily Chart


    Half Hourly Chart


    • Inside day on  the daily charts showing indecision.
    • Flag formation on half hourly charts indicating breakout may be on the upside.
    • Half hourly oscillators moving down towards the oversold region after showing  negative divergence.
    • Daily stochastics in sell in overbought region and Rsi14 weakening before reaching overbought state.
    The upmove from 4675 is  only a pullback, unless 5310 is taken out by end of this week, as this will lead to faster retracement of the fall. So expect the fall to resume if this does not happen.

    Tomorrow's direction will be set by break of the inside day range of 5147-5092. Above 5147 expect 5180 and below 5092 expect 5050. Enter new longs only on dips or breakout from the flag formation.

    Stop loss would be 5070-5050 range.Longs with a slightly longer term view could place their stops at a close below the up trendline from 4675.


    Happy Trading !!

    Lakshmi Ramachandran
    www.vipreetsafetrading.com

    Monday, March 8, 2010

    Reigning The Nifty - 9th March, 2010


     Daily Chart


    Half Hourly Chart


    • Bullish candle maintaining above the uptrendline of the channel  shown in daily chart.Support at 5100.
    • Daily stochastic has given a sell in the oversold region, Rsi14 and macd moving up strongly.
    • Half hourly oscillators still showing negative divergence.
    • Moving averages on all time frames giving bullish bias.
    Trend continues to be up . Fresh longs only on dips. Stop loss of 5070 on  exisiting longs.


      Happy Trading !!

      Lakshmi Ramachandran
      www.vipreetsafetrading.com

      Sunday, March 7, 2010

      Reigning The Nifty - 8th March, 2010


       Weekly Chart


      Weekly Negative Divergence


      • Follow-up buying on lower volumes than the previous week formed a Bullish candle .
      • Maintained within the channel . Support at 4753 and resistance at 5405.
      • Negative Divergence and falling  volumes  on the rise since May 2009 makes the sustainability of the rise, suspect.

      Daily Chart


      • A doji with a long upper shadow was formed but the higher top higher bottom  mainatained.
      • Volumes increased in the last two days ,both days showed signs of the rise stalling. This calls for caution .
      • Third consecutive day the Nifty maintained above the upper channel trendline and above 61.8% retracement levels.
      • The 5,10 and 20 ema are bullishly aligned once again.
      • Stochastics in oversold area and Rsi14 moving towards it.

      Half hourly Chart


      • Consolidation/Distribution in an equilateral triangle.
      • All oscillators weak after showing negative divergence.

      Sensex


       Filling the gap, shown on the sensex, was crucial for further upsides. The gap was filled but sensex could not close above it. Look for a close above friday's high of 17097, above which the recent top of  17790 could be achievable.

      Markets have run up fast after building good support at 4950. The trend is up and one should be long.  As negative divergences are persisting one should keep stop loss around 5000-5050 levels.Booking profits with pattern targets in mind would be prudent.Please refer to pattern targets in my earlier posts.


      Happy Trading !!

      Lakshmi Ramachandran
      www.vipreetsafetrading.com