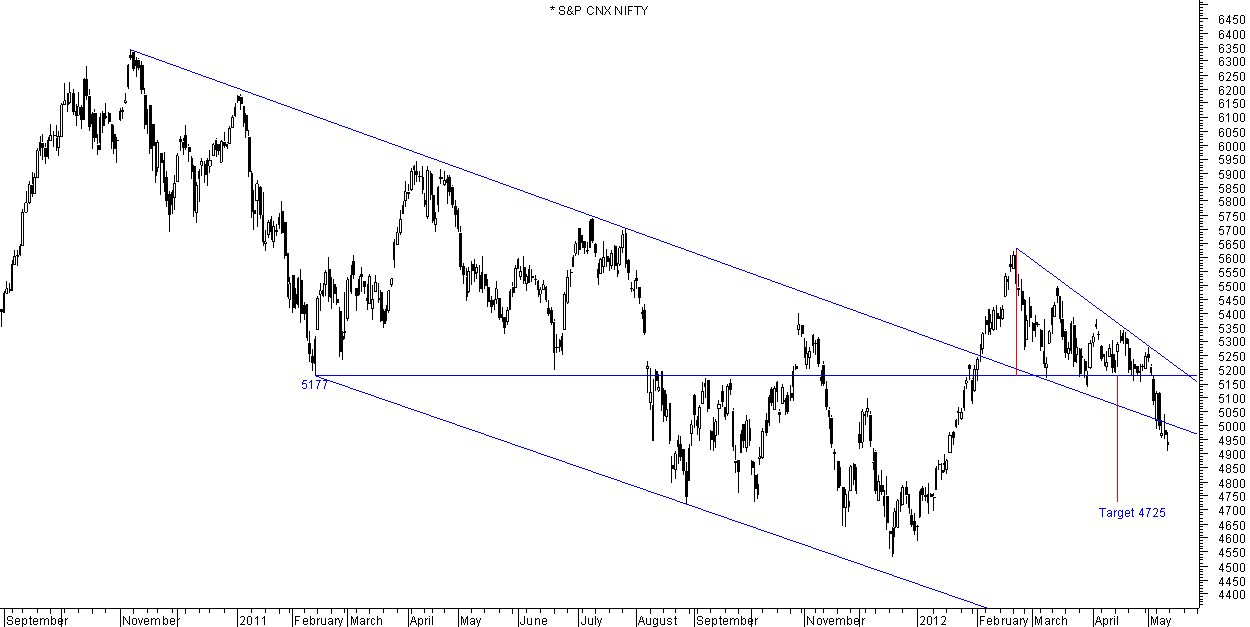
Om Sri Ganeshaya Namaha

Om  Sri  Ganeshaya  Namaha
follow me on twitter http://twitter.com/#!/lucksr

Tuesday, May 29, 2012

Will Be Back Soon


Attending my nephew's marraige at Michigan. Should be back next week.


follow me on twitter http://twitter.com/#!/lucksr 

Happy Trading !! 
Lakshmi Ramachandran
www.vipreetsafetrading.com

S&P500 21st May 2012


Weekly Chart


Daily Chart


S&P500 hit 1292 as anticipated.The weekly chart shows support taken on the pink neckline of the head and shoulders formed in 2011.This is strong support and a break will increase the downward momentum.


follow me on twitter http://twitter.com/#!/lucksr

Happy Trading !!
Lakshmi Ramachandran
www.vipreetsafetrading.com

Reigning The Nifty 21st May 2012


Weekly Chart


Weekly Chart


Weekly candle has a long lower shadow maintaining above the uptrendline drawn from 2008 lows of 2252.This shows good buying support at this support.However a lower high and low were made for the week.Stochastics is in oversold zone but Rsi14 is yet to reach the same. Macd has given a downtick below zero line.This indicates more selling may come.


Daily Chart


Bullish candle on the daily charts taking support at the 76.4 % (4790) retracement level of the rise from 4531 lows to 5620 highs and 38.2% retracement level (4777) of the rise from 2008 lows to 6338 highs.This is encouraging as it was a fibonacci confluence level.Therefore a bounce from such a strong level may be strong too.Oscillators have turned up from the oversold region indicating the bounce may continue.


Half Hourly Chart


Half hourly charts show a close above the short term downtrendline.A series of peaks and fibonacci resistances need to be overcome for the Nifty to come back to bullishness.


follow me on twitter http://twitter.com/#!/lucksr

Happy Trading !!
Lakshmi Ramachandran
www.vipreetsafetrading.com

Reigning The Bank Nifty 21st May 2012


 Weekly Chart


Weekly candle has a long lower shadow maintaining above the uptrendline drawn from 2011.This shows good buying support at this support level.However a lower high and low were made for the week.Stochastics is in oversold zone but Rsi14 is yet to reach the same. Macd has given a downtick.This indicates more selling may come.


Daily Chart


Bullish engulfing candle on the daily charts taking support on the uptrendline from December 2011 lows.This is a reversal pattern. Oscillators have turned up from the oversold region indicating the bounce may continue.
Trend following indicators have turned bearish.The 50 and 200 dema have given a death cross.Bulls need to be really aggressive to turn the tide towards the upside.


Half Hourly Chart


Half hourly charts show a close above the short term downtrendline.A series of peaks and fibonacci resistances need to be overcome for the Bank Nifty to come back to bullishness.


follow me on twitter http://twitter.com/#!/lucksr

Happy Trading !!
Lakshmi Ramachandran
www.vipreetsafetrading.com

Friday, May 18, 2012

S&P500 18th May 2012


 Daily Chart


Extremely bearish candle closing below the 200 dema.The 1290-1292 area should hold as it is the 38.2% retracement level of the rise from 1075 and the peak made in October 2011.The triangle pattern target is at 1295.If fails then will slide to 1250-1202.


follow me on twitter http://twitter.com/#!/lucksr

Happy Trading !!
Lakshmi Ramachandran
www.vipreetsafetrading.com

Reigning The Nifty 18th May 2012


Daily Chart


Half Hourly Chart


Today's daily candle resembles an invereted hammer candle pattern which is bullish.Yesterday's downward gap  closed.Yesterday's low was maintained which has broken the lower low streak of the last 9 trading sessions.Nifty is oversold too which supports short term pullback.
However the pullback could be weak as the  Nifty could not even  attempt to scale the last peak at 4954 thus making a lower peak at 4922.The 5/20 got whipsawed again.Only a move and close  above 4958 can get the bulls to stage a pullback.


follow me on twitter http://twitter.com/#!/lucksr

Happy Trading !!
Lakshmi Ramachandran
www.vipreetsafetrading.com

Reigning The Bank Nifty 18th May 2012


Daily Chart


Half Hourly Chart


An inverted hammer after a hammer maintaining the low of the hammer.Yesterday's downward gap too closed.Both are bullish patterns and with the Bank Nifty oversold on daily charts we may expect the pullback to materialise.However the pullback could be weak as the Bank Nifty could not even sustain the 23.6% retracement level and did not even attempt to scale the last peak at 9361 thus making a lower peak at 9328.The 5/20 got whipsawed again.Only a move and close  above 9361 can get the bulls to stage a pullback.


follow me on twitter http://twitter.com/#!/lucksr

Happy Trading !!
Lakshmi Ramachandran
www.vipreetsafetrading.com

Thursday, May 17, 2012

S&P500 17th May 2012


Daily Chart


 1295 looks within reach now.The candle formed resembles an Inverted hammer though not to the 'T'.If tomorrows candle makes a higher high a pullback may be in place due to the oversold status.


follow me on twitter http://twitter.com/#!/lucksr

Happy Trading !!
Lakshmi Ramachandran
www.vipreetsafetrading.com

Reigning The Nifty 17th May 2012


 Daily Chart


Half Hourly Chart


Yesterday's bullish engulfing pattern failed to follow through giving in to bear pressure.The gap down too not being filled increases the bearishness.The daily oscillaotrs are oversold indicating the Nifty may see a pullback soon.
The falling wedge breakeout on half hourly charts  failed and the Nifty is back below the downtrendline.The gap made between 4943-4882 will prove stiff resistance and till it is closed the trend will continue down.The minor peak at 4976  needs to be taken out decisively for the rally to materialise.Stiff resistance at 4954-4958 exists.With the 20/50 ema giving a 400 point gain to the bears already partial profits on shorts need to be taken in anticipation of a pullback.


follow me on twitter http://twitter.com/#!/lucksr

Happy Trading !!
Lakshmi Ramachandran
www.vipreetsafetrading.com

Reigning The Bank Nifty 17th May 2012


Daily Chart


 Half Hourly Chart


Daily charts show a hammer pattern formed as per the candlestick theory.This is a bullish pattern with confirmation necessary from the next day's candle with a minimum requirement of maintaining the low of the hammer. Oscillators too oversold on daily supporting the view.
On the half hourly charts the 5 and 20 ema have been desperately trying to maintain a buy  but have failed  and whipsawed several times.The 20 and 50 ema  have been in a sell for almost a 1250 point gain to the bears.A pullback is due soon and one needs to book partial profits on shorts.
Breaking out of the falling wedge and a close above the latest peak will be the first sign of a sustained pullback.


follow me on twitter http://twitter.com/#!/lucksr

Happy Trading !!
Lakshmi Ramachandran
www.vipreetsafetrading.com

Wednesday, May 16, 2012

S&P500 16th May 2012


Daily Chart


 1290 is the 38.2% Fibo level as shown on the chart.1292 is the peak made in September and 1295 is the triangle target. Looks like this will be strong support.


follow me on twitter http://twitter.com/#!/lucksr

Happy Trading !!
Lakshmi Ramachandran
www.vipreetsafetrading.com

Reigning The Nifty 16th May 2012


Daily Chart


Half Hourly Chart


A bullish engulfing pattern while the daily oscillaotrs are oversold indicates the Nifty may see a decent rally.The falling wedge on half hourly charts brokeout on the upside but was not too impressive.The minor peak at 4976 and the red trendline of the expanding triangle which has resistance at 4952-5941 for the day needs to be taken out decisively for the rally to materialise.


follow me on twitter http://twitter.com/#!/lucksr

Happy Trading !!
Lakshmi Ramachandran
www.vipreetsafetrading.com

Reigning The Bank Nifty 16th May 2012


Daily Chart


 Half Hourly Chart


Pullback came in but seems just a technical pullback as the lower high lower low sequence of candles continues.Reaction came in before reaching even the 23.6% retracement level of the last leg from 9924.Only a decisive breakout from the falling wedge scaling at least the 61.8% level at 9643 is necessary to get the bears to retreat.


follow me on twitter http://twitter.com/#!/lucksr

Happy Trading !!
Lakshmi Ramachandran
www.vipreetsafetrading.com

Tuesday, May 15, 2012

S&P500 15th May 2012


Daily Chart


Bears enjoying the slide to 1295.Bump ahead at 1314-1300.


follow me on twitter http://twitter.com/#!/lucksr

Happy Trading !!
Lakshmi Ramachandran
www.vipreetsafetrading.com

Reigning The Nifty 15th May 2012


Daily Chart


Half Hourly Chart


The lower low lower high candle formation on the daily charts and the falling wedge on half hourly charts continued today.Short term reversal and resistance level is now at 4976-4985.Seems the target of 4725 shown yesterday is achievable.Positive divergence on half hourly oscillators and the oversold daily oscillators may give rise to a pullback which would best be sold into.


follow me on twitter http://twitter.com/#!/lucksr

Happy Trading !!
Lakshmi Ramachandran
www.vipreetsafetrading.com

Reigning The Bank Nifty 15th May 2012


Daily Chart


Daily Line Chart


Half Hourly Chart


Bearish engulfing pattern on daily charts.This could well be a bullish signal as it has occured after a substantial fall. A bearish engulfing pattern after an extended down trend  represents the bears final attempt to drive the market price lower. If one is short and a Last Engulfing Bearish pattern forms, one should identify a protective stop level near the highs of the Last Engulfing Bearish pattern to protect any profit in the trade. Positive divergence on half hourly oscillators and oversold daily oscillators support this view.

Daily Line Chart shows the bank Nifty could test the lower end of the range at around 7800.Sell on rises.

follow me on twitter http://twitter.com/#!/lucksr

Happy Trading !!
Lakshmi Ramachandran
www.vipreetsafetrading.com

Monday, May 14, 2012

S&P500 14th May 2012


 Weekly Chart


Decisive break below the triangle giving a target of 1295.


Daily Chart


If 1340 holds the upmove could be salvaged else target of 1295 achievable


follow me on twitter http://twitter.com/#!/lucksr

Happy Trading !!
Lakshmi Ramachandran
www.vipreetsafetrading.com

Reigning The Nifty 14th May 2012


Weekly Chart


Weekly Chart


Breakdown on increased volumes.The Nifty is back into the downtrendling channel which it had broken out from giving a bullish call.Now the possibility of heading lower has increased. The neckline at 4531 is now under threat.4985 and 5136 will be the first barriers that need to be crossed for the bulls to make a comeback.
Stochastics is in the oversold zone increasing the possibility of a pullback.Rsi14 shows more place for weakness.It is a sell on rise market now.unless the bulls show their presence by breaking above 5208.


Daily Chart


Daily Chart


Daily Chart


The Nifty made a doji which gapped down but managed to close the gap during the day.The 61.8% retracement has been surpassed inidcating a down trend is in place.
Three dojis in a row show the bears may be weakening.Rsi14 and stochastics have reached the oversold zone supporting a pullback.5060 will be stiff resistance.With the possibility of the Nifty testing 4725 as shown in the chart above a sell on rise would be prudent.


Half Hourly charts show a falling wedge which is a bullish pattern.Breakout on the upside will find multiple resistance at the levels marked on the charts.

Half Hourly Chart


follow me on twitter http://twitter.com/#!/lucksr

Happy Trading !!
Lakshmi Ramachandran
www.vipreetsafetrading.com

Reigning The Bank Nifty 14th May 2012


 Weekly Chart


A gap down opening for the week as anticipated in last week's analysis.The gap was closed immediately but the bears dominated and selling continued throught the week breaking below the flag pattern.Support  taken on the downtrendline from November 2010 highs.This needs to hold else selling will intensify and has chances of touching the support line of the down trending channel from which the Bank Nifty had successfully broken out.
Rsi14 is below the 50 mark showing more weakness to come.Stochastics is below 20 mark showing oversold status.This would mean a sell on rise would be beneficial.

Weekly Chart


 Daily Chart


A minor lower low made but the small real body and long upper shadow could be conveying that selling may pause for some time.Support taken on the red dotted support line of the flag formation is encouraging.The oversold Rsi14 and Stochastics support this view.


Half Hourly Chart


The falling wedge shown on thursday failed to play out. Another rising wedge has formed alongwith positive divergence on half hourly charts.This may lead to some recovery. Strong resistance at 9532 as shown on the chart.

Till 9924 is crossed decisively sell on rises.


follow me on twitter http://twitter.com/#!/lucksr

Happy Trading !!
Lakshmi Ramachandran
www.vipreetsafetrading.com

Friday, May 11, 2012

S&P500 11th May 2012


Daily Chart


Low of  1343 maintained  and a higher high higher low candle formed.Fibonacci retracement levels and the 200 dema remain unviolated.  The long upper shadow resisting near the trendline joining lows of 1340-1357  however  is not encouraging. 
Lower low at 1343 and lower high at 1415 ,break below the uptrendline from 1075 lows, bearish crossover of 20 & 50 dema, sets the short term trend down.
1340 key levelfor holding longs.Triangle target of 1295 is difficult till 1340 holds.


follow me on twitter http://twitter.com/#!/lucksr

Happy Trading !!
Lakshmi Ramachandran
www.vipreetsafetrading.com

Reigning The Nifty 11th May 2012


Daily Chart


Daily Chart


Half Hourly Chart 


An Outside Day pattern and another inverted hammer on daily charts indicating probability of a short term reversal.Supporting this view is the fast approaching oversold status of the Rsi14 ,  Stochastics , OBV has not fallen below it's previous low of this correction and a falling wedge on the half hourly charts.Flag formation too still valid.

Strong resistance at the 5029-5039 levels.Only a cross above 5136 will bring in upward momentum.


 follow me on twitter http://twitter.com/#!/lucksr

Happy Trading !!
Lakshmi Ramachandran
www.vipreetsafetrading.com

Reigning The Bank Nifty 11th May 2012


Daily Chart


Daily Chart II


Half Hourly Chart 


A doji on daily charts indicating probability of a short term reversal.Supporting this view is the fast approaching oversold status of the Rsi14 ,  Stochastics , OBV positive divergence and a falling wedge on the half hourly charts.Flag formation too still valid.

Strong resistance at the 9580 levels.Only a cross above 9845 will bring in upward momentum.


follow me on twitter http://twitter.com/#!/lucksr

Happy Trading !!
Lakshmi Ramachandran
www.vipreetsafetrading.com

Thursday, May 10, 2012

S&P500 10th May 2012


Daily Chart


Broke the red trendline joining lows of 1357 and 1348 intraday but closed well above it.Made a low of 1343 today which is close to the strong support of 1340.If  holds will find resistance at 1367.Else will seek to achieve the triangle target of 1295.


follow me on twitter http://twitter.com/#!/lucksr

Happy Trading !!
Lakshmi Ramachandran
www.vipreetsafetrading.com