Om Sri Ganeshaya Namaha

Om  Sri  Ganeshaya  Namaha
follow me on twitter http://twitter.com/#!/lucksr

Thursday, September 30, 2010

S&P 500 update --30th September


Daily Chart I


Daily Chart II


Not much action so not much change in the technicals too.An Inside day pattern formed making the high and low of the previous day significant breakout points. Thus a move above 1150 and below 1132 would give some momentum.
Resistance at  1153-1158  Support at 1141-1138-1132.


Happy Trading !!
Lakshmi Ramachandran
www.vipreetsafetrading.com

Reigning The Nifty 30th September , 2010


 Daily Chart


Caution about the bearish indications  yesterday paid off and the bearishness took effect. It was a wide ranging day encompassing the last two days range.Bearish because it  closed below that  range.  The Nifty ended 38 points down, taking support exactly on the green trendline at 5992. The range of 5932-6073 is intact and the lower end is expected to be tested. If broken, expect downward momentum to accelerate and give a 140 point move to 5792. That should coincide approximately with the 38.2% fibo retracement level of rise from 5350 , at 5775.

Resistance at  6001-6018-6026-6038.    Support at 5932-5903-5875-5838.


Happy Trading !!
Lakshmi Ramachandran
www.vipreetsafetrading.com

Wednesday, September 29, 2010

S&P 500 update --29th September

 Daily Chart


The range 1122-1150  remained unbroken .The positive was that trading was restricted to the upper part of the range and selling was soon absorbed to close in the positive at 1148.


Daily Chart II


The formation shown in the second chart is more like a rising wedge (bearish)  than an ascending triangle (bullish). The argument in favour of ascending triangle is that the upper trendline is only marginally sloping upwards thus indicating an upward breakout..However keep a watch in case the lower trendline breaks, which has support  at 1135.10.The resistance to overcome is at 1150.40
Resistance at  1150-1152-1158-1174.  Support at 1144-1136-1122.


Happy Trading !!
Lakshmi Ramachandran
www.vipreetsafetrading.com

Reigning The Nifty - 29th September, 2010


 Daily Chart


A hanging man after a shooting star. Two bearish candles in a row after a new top rings alarm bells.The fact that resistance at 6038 was respected once again makes one cautious of a reversal.The uptrendline from 5349 shown in red has been broken by a sideways move rather than a bearish down move.To add to the bearish signals, Nifty made a lower high and lower low.

Oscillators are showing negative divergence on daily charts.Breadth continues to be negative. Volumes were average.

 
 Half Hourly Chart


Half Hourly Charts show a break below the uptrendline from 5349. Support taken near the 61.8% fibo level of rise from 5932 to 6073. But the recovery in the last hours hit resistance exactly at the  61.8% fibo level of fall from 6073-5991 and the  uptrendline from 5349. Resistance from this trendline is at 6045-6078.

The range of 5932-6038 needs to be broken before any meaningful move can come in.A new rising wedge is seen as shown  on the chart. Appearance of quite a few bearish signals !

Trade light and with strict stops.


Happy Trading !!
Lakshmi Ramachandran
www.vipreetsafetrading.com

Tuesday, September 28, 2010

S&P 500 update --28th September

 Daily Chart


The 1150 level is proving strong resistance leading to a sideways correction. The range between 1122-1150 needs to be broken decisively to gain momentum , obviously on the side of the breakout. At the moment predicting the direction is a little fuzzy, though, till the 1131 level is held breakout on the upside is expected.

Support at 1137-1131-1122  and  Resistance  at 1152-1159.


Happy Trading !!
Lakshmi Ramachandran
www.vipreetsafetrading.com

Reigning The Nifty - 28th September, 2010


Daily Chart 


The Nifty made a shooting star  which is bearish. Daily oscillators have started showing negative divergences. The intraday breakout from the range of 5932-6037 could not sustain but the sell off was very hesitant.Volumes were low.

The steep red channel was maintained. Breadth was only marginally negative. The Nifty must close above 6045 to remain within this channel. I have drawn the rising wedge too which has support at 5962.


Good support exists at 6003-5982-5962. A break below this will lead to a retest of 5932.A break below this support will give a 100 point move.

Resistance is at 6045-6073-6100.
 
 
Happy Trading !!
Lakshmi Ramachandran
www.vipreetsafetrading.com

Monday, September 27, 2010

S&P 500 update --27th September


Daily Chart


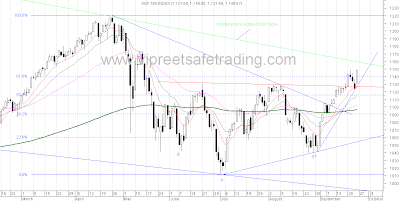
A bullish candle recovering the entire fall of the last three days. The close too is the highest since the May bottom. A new upward sloping  channel has emerged shown in pink.Resistance from this channel is at 1151.
The S&P is really close to a breakout from the  downtrendline from October 2007 shown in green.A breakout from this down trendline will be really bullish.Resistance from this trendline is at 1159. Support at  1132 at the uptrendline from 1040.

Resistance at  1151-1159 Support at 1132-1122.


Happy Trading !!
Lakshmi Ramachandran
www.vipreetsafetrading.com

"Responsible Newspaper Publishing"

I just put up an article "Responsible Newspaper Publishing" on my blog http://lakshmispointofview.blogspot.com/   Please give me your reaction and views


Lakshmi Ramachandran
www.vipreetsafetrading.com

Sunday, September 26, 2010

Reigning The Nifty 27th September , 2010


Weekly Chart


A good bullish follow up candle for the week on good volumes but falling breadth.Negative divergence continues in Rsi14,Macd and Roc12.The oscillators have however started moving up and macd continues to be in buy. The three bull candles in a row speak of a strong uptrend. At this juncture it is better to keep supports in mind and trade with sensible hedging to enjoy the ride, as liquidity driven rises can go to any heights. Support at 5860  and Resistance is at 6129.


Daily Chart


Daily Charts show a range formed in the last four days between 5932 and 6037. The steep channel has still been maintained. The support level though is going higher at a steep rate by the day which will be difficult to maintain thus should result in a sideways or downward correction soon.This does not mean going short. I would not , till a good close below 5350 which is the intermediate swing low.Oscillators Rsi14 and Stochastics are overbought.


Half Hourly Chart


The half hourly charts show a bullish breakout from the falling wedge shown on Thursday.Support was taken at the 38.2% fibo level which is also a bullish signal. This could give a move till 6193.


Daily Chart II


At last successful at drawing a bearish pattern -- a rising wedge with support at 5920 !!

Supports are at 5966-5951-5920-5874.  Resistance at 6037-6050-6100.


Happy Trading !!
Lakshmi Ramachandran
www.vipreetsafetrading.com

Friday, September 24, 2010

S&P 500 update --24th September

 Daily Chart


Chart II


Follow up selling led to a break below the neckline which is a negative. The fact that the break above the 61.8% retracement level could not sustain shows lack of momentum on the upside.The support from the 10dema at 1123 held .This was also the 23.6% retracement level as shown in chart II.

Support is at  1114-1107-1094-1082 .

Resistance is at 1137-1144-1150.


Happy Trading !!
Lakshmi Ramachandran
www.vipreetsafetrading.com

Reigning The Nifty - 24th September, 2010


Daily Chart


 Half Hourly Chart


A lower top lower low candle on very low volumes and marginally negative breadth at 1:1.15.The break below yesterday's low did not last long. Support came in at the uptrendline from lows of 5349.All this points at hesitant profit taking by nervous bulls rather than selling by aggressive bears.

Half hourly charts show a  falling wedge which is a bullish pattern. Breakout from this pattern will lead to a resumption of the bull run.

Good support exists at 5930-5875.  Resistance at 5975-6006-6037.

Happy Trading !!
Lakshmi Ramachandran
www.vipreetsafetrading.com

Thursday, September 23, 2010

S&P 500 update --23rd September

 Daily Chart


A lower high and lower low was made breaking below the uptrendline from 1040, turning the bias to negative. The neckline was unharmed.Till the neckline holds bulls could have hopes of higher levels.

Support at  1131-1123-1110.    Resistance at 1144-1149-1159.


Happy Trading !!
Lakshmi Ramachandran
www.vipreetsafetrading.com

Reigning The Nifty 23rd September , 2010


 Daily Chart


An outside day with a higher high and a higher low but no big enough range to signal a clear reversal. Also the close formed a doji showing indecision and confusion with the upper and lower shadows almost equal.The intraday volatility signalled profit booking rather than selling.Volumes were low  with advancing volumes higher than declining volumes. Breadth was negative

Girish, a boarder on Vipreet's discussion forum commented while putting forth his view that the short term trend has turned bearish :
Last week Nifty used to do this --Gap up to previous days highs and continue the run for another 40-60 points in the very first hour. Now what is it doing - Gap up to previous day's high and sell off 50-70 points. Is that a bullish sign? 
Nice way of putting it across that a breather may be starting.


The uptrending channel has support at 5937 and resistance at 6105. 5937 is also the 38.2% fibo level of rise from 5775 to 6037.


A short term trade could be taken  in the direction of the break of  today's outside day high /low.


Happy Trading !!
Lakshmi Ramachandran
www.vipreetsafetrading.com

Wednesday, September 22, 2010

S&P 500 update --22nd September 2010


 Daily Chart


Daily Chart II


Stalling  efforts by the bears to which bulls seem to have succumbed to some degree. The low and close of the candle have gone below the 61.8% retracement level which was crossed so smoothly on Monday.The higher high higher low sequence was however maintained.Moving averages are all bullishly aligned and their rise seems more robust than the rise in July and August. The breakout from the inverse head and shoulders too is intact.

Immediate support is at 1139.80 on the uptrendline from the lows of 1040. A break  of  this trendline could find support at 1123-1107. Resistance is at 1148-1160.


Happy Trading !!
Lakshmi Ramachandran
www.vipreetsafetrading.com
Reigning The Nifty 22nd September , 2010


Daily Chart


Daily Chart II


6000 conquered but not all sectors participated. Breadth was negative.Volumes were good but declining volumes more than advancing.The nifty is highly overbought with a straight upmove of  700 points from the low of 5350. Booking partial profits or hedging one's portfolio would be prudent.

Pattern targets are shown on chart II.

Resistance is at 6033-6055-6200  and   Support at  5962-5935-5905.


Happy Trading !!
Lakshmi Ramachandran
www.vipreetsafetrading.com

Tuesday, September 21, 2010

S&P 500 update --21st September


Daily Chart


The follow up to the pennant breakout was good with yesterday's huge bullish candle crossing and closing above the 61.8% fibonacci level. This move has a target of 1152 , top of 1131 + head to neckline 21 points.

Support at 1122, low of the pennant breakout day.    Resistance from the green trendline is at 1161.


Happy Trading !!
Lakshmi Ramachandran
www.vipreetsafetrading.com

Reigning The Nifty 21st September, 2010


 Daily Chart


Daily Chart II


No signs of fatigue.Nifty is experiencing the adrenaline rush.The breadth was positive and volumes good.

Have been successful in drawing valid trendlines to give the next resistance and support. Next targets are 6015 restricted by the trendline and 6200 the fibo level shown on chart I.

Supports are at 5860 -5800.


Happy Trading !!
Lakshmi Ramachandran
www.vipreetsafetrading.com

Monday, September 20, 2010

S&P 500 update --20th September


Daily Chart


The Inside Day breakout was on the upside as indicated by the pennant.The break above the earlier high of 1131.23 was very marginal at 1131.47. The breakout though was disappointing as  the close could not sustain abive the neckline which  continues to be too strong resistance for the bulls.The bears put up a good fight  resulting   in a   doji .

The 50 dema has bullishly crossed over the 200 dema once again . But till the neckline is crossed decisively and there is a consistent and decisive close above the earlier high of 1131, the bullishness of the crossover is suspect as proved on the two  earlier occasions in July and August.


Bearish Head and Shoulders  Pattern


If the bullish neckline is not broken out then this bearish head and shoulder neckline threatens. Support at the neckline is at 994.

Supports are at 1110-1096   and Resistance at  1131-1141.


Happy Trading !!
Lakshmi Ramachandran
www.vipreetsafetrading.com

Reigning The Nifty - 20th September, 2010


Weekly Chart


Weekly Charts are very bullish with a huge bullish candle giving credibility to last week's breakout.The resistance of 5705 was also broken easily opening up possibilities of attempting a move to 6260-6357.Negative divergences are intact but the oscillators have moved above the previous few peaks made since August 2009 showing momentum has picked up.Volumes were good but breadth disappointed.However breadth improved on the last day of the week.Weekly support at 5700 -5564. 


Daily Chart


Today was an Inside Day and inspite of the bullish candle of 56 points, the day will have to be termed as indecisive as yesterday's range could not be broken.However the fact that the bullishness came after some sharp selling on Thursday  makes the move positive. Breadth too was positive today after remaining negative for most of the week.Volumes too were good . A move breaking the Inside day range of 5815-5901 could catapult Nifty to 6000 or pull it back to 5700.All oscillators except the macd are in the overbought zone.

Supports are at  5860-5835-5765       Resistance is at 5900-5955-6000.


Happy Trading !!
Lakshmi Ramachandran
www.vipreetsafetrading.com

Friday, September 17, 2010

S&P 500 update --17th September


Daily Chart


Lacklustre day without much change in the technicals. An Inside day was formed wherein the current candle's range is contained within the previous candle's range.This shows indecision. The immediate direction will be on the side of the breakout from the inside day's range which is 1126-1114.

The last 4 days action has formed a pennant. The levels for the breakout and breakdown are 1125 and 1115. A pennant being  a continuation pattern,  the break  should be on the upside giving a move equal to the post which measures 35 points.


Trade in the direction of the break of the Inside pattern range.

Happy Trading !!
Lakshmi Ramachandran
www.vipreetsafetrading.com

Reigning The Nifty - 17th September, 2010


 Daily Chart


Daily Chart II


The bears are rejoicing though it was just the first black candle in this relentless rally from 4349. The fall was on good volumes but the breadth was only marginally negative. The bulls feel that it is just a breather. The higher high and higher low sequence is still intact.  The oscillators need to cool down a bit after being  overbought. 

The fact that the Nifty is nearing it's earlier top and the relentless rally from 5349 had both the bulls and bears wondering nervously about further movement . Today's action , was unnerving in such a situation. A negative open , recovery, a sharp  fall followed by a sharp rise to a new high above 5901 and a fall again to a newer low for the day.The intraday chart shows it all.


Half Hourly Chart


The channel break target is at 5773 coinciding with the 161.8% fibo level of rise from 5820-5901.It is also the 23.6% retracement level of rise from 5349 to 5901.This should be good support.5790 is support on the uptrendline from 5349.

Supports are at 5772-5690-5626-5560  Resistance at  5837-5850-5860-5870-5901.


Happy Trading !!
Lakshmi Ramachandran
www.vipreetsafetrading.com

Thursday, September 16, 2010

S&P 500 update --16th September

 Daily Chart


A lower high and a lower low but very marginally so. No direction was set in today's trade. The bullish engulfing candle is not to be read as bullish unless the high of the doji candle of tuesday is crossed decisively. If the low of yesterday's candle at 1114.63 is broken then there could be more follow up selling.

Resistance at the neckline continues to prove a strong hurdle for bulls.Bears not taking advantage of the situation either. Meanwhile the 20 dema has crossed over bullishly above the 200 dema. With the Dema's getting bullish , Bulls could be encouraged to make a strong attempt to crossover the neckline hurdle.

Watch out for a breakout above 1131 to go long or go short on  a pull back that goes below 1113.


Happy Trading !!
Lakshmi Ramachandran
www.vipreetsafetrading.com

Reigning The Nifty - 16th September, 2010


Daily Chart


Nifty continued to march up without much hesitation on good volumes almost reaching the target of 5872. The breadth once again was not supporting. Negative divergences have disappeared and the Rsi 14 and Stochastics are in overbought zones.Macd  continues to be in negative divergence but is moving up fast and has scaled it's  April 2010 peak.

The 5dema, support from up trendline from 5349  and the 23.6% fibonacci retracement  level of rise from 5349 coincides  at 5750,  making it strong support.

Resistance at 5880-5940   and Supports at  5834-5775-5750.


Happy Trading !!
Lakshmi Ramachandran
www.vipreetsafetrading.com

Wednesday, September 15, 2010

S&P 500 update --15th September


 Daily Chart


Dangerous doji at neckline resistance trying to scare away the bulls. The doji stands for indecision . To be seen whether the bulls give up or successfully break above the neckline. Moving averages  are giving bullish crossovers -- 10dema > 20, 50 and 200 dema ,  and the 20 dema > 50 dema   implying  the bulls are gaining strength.

The doji at neckline resistance is a caution to the bulls.Wait for a decisive closing above this resistance to get short term bullish.

Happy Trading !!
Lakshmi Ramachandran
www.vipreetsafetrading.com

Reigning The Nifty - 15th September, 2010


 Daily Chart


Daily Chart II


One more resistance , 5786,  crossed and one more high for the rally at 5838 . But nervousness which was not seen at the 5600 and 5700 levels was visible today at the 5800 levels which was crossed easily but found sharp selling from the highs. The fall was small a support was  found  at 5775 , to close  positive by 35 points.

The rise from the 5349 levels of around 500 points has been sharp. To add to the  feeling of nervousness due to the sharp small falls was the breadth which was extremely negative. Volumes were high  with declining volumes exceeding advancing volumes. Daily Oscillators  have reached the overbought zone.

Good support exists at 5744 shown on chart II. The 3 DSMA is at 5731.The uptrendline from 5349 gives support at 5716. Thus the  Nifty has a good cushion around the 5715-5750 levels. This could be a good stop loss level for existing positional longs.

Resistance at  5815-5838-5850-5872.


Happy Trading !!
Lakshmi Ramachandran
www.vipreetsafetrading.com

Tuesday, September 14, 2010

S&P 500 update --14th September

 Daily Chart


A little more effort from the bulls to cross 1131 and they will be in charge. The 61.8% retracement level at 1140 is threatening too. So buck up bulls ! More effort needed.


Happy Trading !!
Lakshmi Ramachandran
www.vipreetsafetrading.com

Reigning The Nifty - 14th September, 2010


 Daily Line Chart


Daily Candle Chart


Nifty defies gravity and traders are suffering from vertigo especially those trading short. The upmove continues relentlessly. Breadth was 1:1 which is not very encouraging as the upmove did not see a whole hearted participation.Volumes were in line with that of the past few days --just average. Oscillators are slowly shrugging off the negative divergence and reaching overbought zone.

Line charts show the targets which  translates  to 5954  and 6247 on candle charts and which have been mentioned in my earlier posts.

Resistances are now at  5786-5872 being the fibonacci levels shown on the candle chart. Support is at 5670.


Happy Trading !!
Lakshmi Ramachandran
www.vipreetsafetrading.com

Sunday, September 12, 2010

Reigning The Nifty - 13th September, 2010


 Weekly Chart


Last week the bias had turned negative and the breakout of the 5350-5550 range was anticipated to give us direction. The Nifty successfully and decisively broke out on the upside with a huge bullish candle by almost a 100 points to touch a new high of 5647. This leaves a run of a hundred  points for the Nifty to complete the range break target of 5750. Since we have a four day trading week, looking at volumes would not give the correct picture. This will be analysed on the daily chart. Amongst the oscillators, stochastics and macd continue to be in negative divergence, though  macd continues to be in a buy. Rsi 14 has shown some strength by moving above the peak made in August 2009 .As mentioned in my earlier posts, historically,  resistances on the way up are few.
Resistances  are at 5705-5750-5790 and  Supports are at  5550-5445-5350.


Daily Chart


Half  Hourly Chart


The Nifty continues to make consolidations at regular intervals forcing the bears to interpret it as distribution. Then surprise the bears with a new high supported  by their short covering ! A new high has now become a habit  for this rally  which  has been the most skeptical one I have witnessed .Oscillators are yet in negative divergence showing momentum too never approved of this relentless run from March lows. So we witnessed a new high yet again at 5647. Volumes  have been  very average and the advance decline line continues it's downmove. The rising wedge seen on half hourly charts continues to be support and resistance. So we keep a watch for a break from this pattern to book profits and reduce exposure. Moving average supports are at  5 dema 5587, 10 dema 5545, 20 dema 5506.

Resistance at  5672-5700-5780  and  Supports are at  5610-5567-5500.


Happy Trading !!
Lakshmi Ramachandran
www.vipreetsafetrading.com

S&P 500 update -- 13th September


 Daily Chart


Signs of bullishness creeping in.
  • 10 dema  has bullishly crosses the 20 and 50 demas.  
  • Breakout above the  down trending line from the April 2010  highs of 1220.
  • Daily macd above zero line and weekly macd given a buy.
But the bulls have to work overtime to get past  the neckline of the Inverse head and shoulder pattern around 1128-1131 levels for the diehard bears to surrender.

Resistance at 1115.80. Support at 1109.


Happy Trading !!
Lakshmi Ramachandran
www.vipreetsafetrading.com

Thursday, September 9, 2010

S&P 500 update -- 9th September


Daily Chart 


Not enough strength to breakout above the  down trending line from the April 2010  highs of 1220. Resistance now at 1101.70


Happy Trading !!
Lakshmi Ramachandran
www.vipreetsafetrading.com

Reigning The Nifty 9th September , 2010


 Daily Chart


 Half Hourly Chart


Nifty took support exactly at 5566 on the upper trendline of the red channel from which it broke out . This makes it the third day of maintaining above the breakout level. This also makes the support of this trendline and today's low of 5566 very important. Today's candle did make a lower high and lower low though the high was lower just by a fraction.The low hit the 38.2%  retracement level.

Half hourly charts show nifty taking support on the lower trendline of the now visible rising wedge.The Nifty is typically trying hard to maintain the breakout above the upper trendline. This is depicted well on the half hourly charts.The 50 ema on half hourly charts is at 5563.Weekly support on the trendline joining tops from January 2010 is at 5552.

Moving averages are bullishly aligned on all time frames.Oscillators continue to be negatively diverged. breadth was positive and volumes below average.

Supports are at 5568-5563-5550-5532.  Resistance at  5625-5672.


Happy Trading !!
Lakshmi Ramachandran
www.vipreetsafetrading.com