Monthly Chart

The monthly charts show a bearish doji with a long upper shadow.The close is around the same levels as the last month with a minor loss for Nifty traders.Volumes were very low. ROC 12 and Stochastics continue to show negative divergence.Dojis signal indecisiveness about further direction. In this case it shows doubts about continuation of the uptrend. Trading above the high of the doji is required to negate this view.Logically the upper trendline at 6485 should be tested, failing which a "return failure" would occur, increasing chances of the lower trendline being broken.
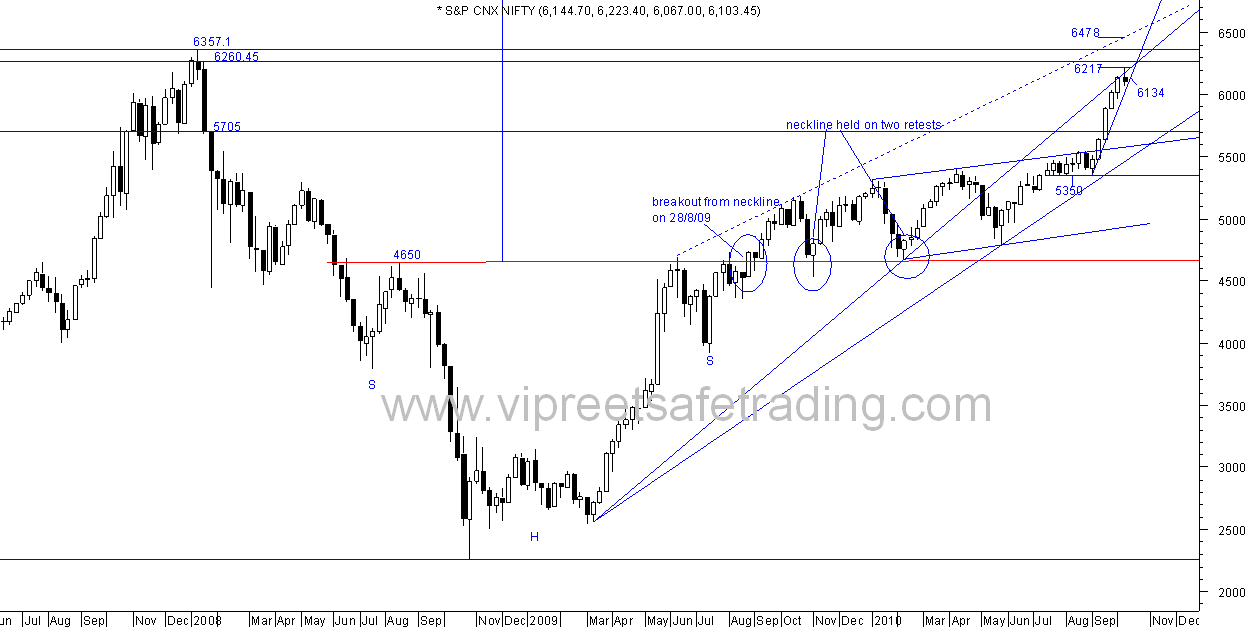
Weekly Chart

Weekly charts show an "outside bar" pattern where the bar has a higher high and a lower low showing loss of direction .The support of 6066 has been broken . The low of 5966 was however held well on Line charts which shows close values only.This keeps the short term uptrend intact.
The negative divergences are intact.
The fall from high of 6284 is in a flag formation shown on weekly chart II. This suggests a consolidation rather than distributuion as it is a bullish formation.
Weekly Chart II

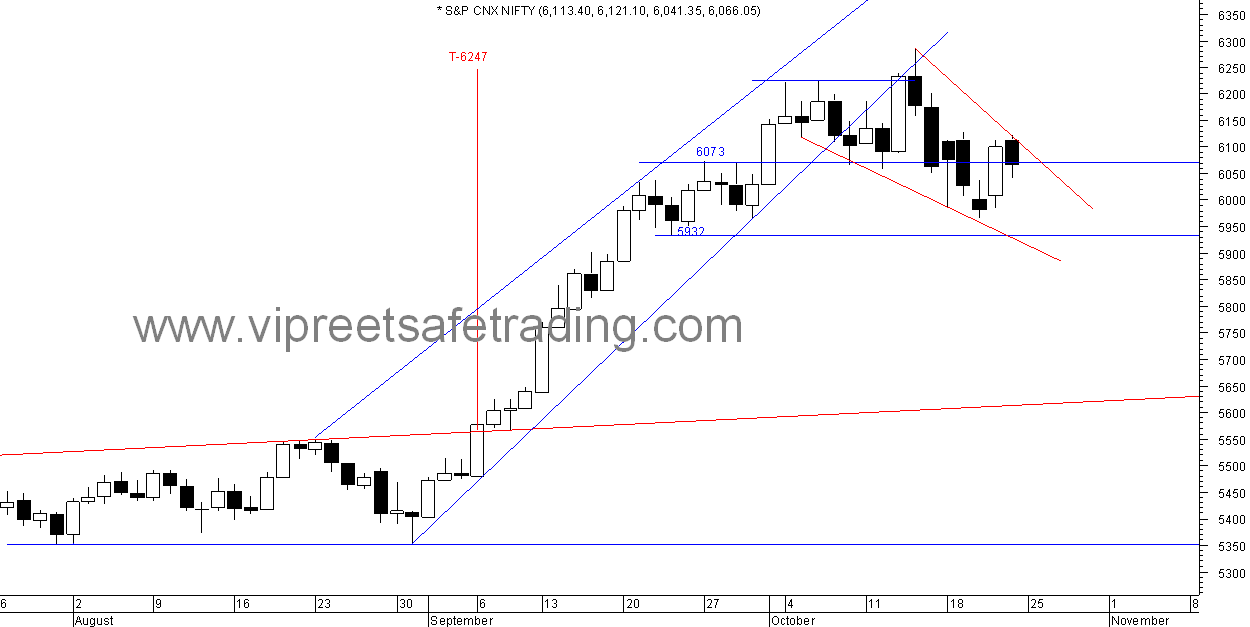
Daily Chart

Daily charts too show a flag formation. The possibility of touching the lower end of the flag at 5870 is high.The long legged doji at support of 38.2% fibo level after a fall is however bullish. Breadth was very negative and volumes low. Neckline was broken intraday but was recovered fast enough.The selling showed nervous bulls rather than ferocious bears.The fact that a lower low on the line charts has not confirmed the lower low on candle charts supports this view.
As stated in my earlier posts shorts to be attempted only on the break of 5350. Longs can be attempted on the flag breakout.Aggressive longs only on the scaling of 6284 high.
Happy Trading !!
Lakshmi Ramachandran
www.vipreetsafetrading.com