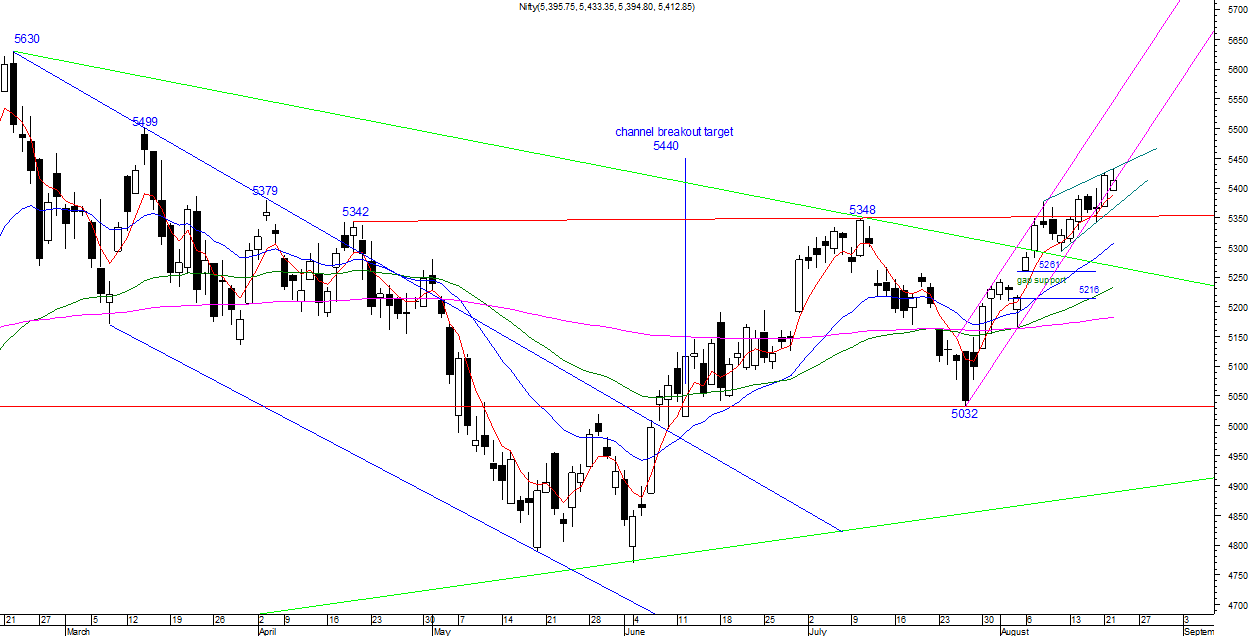
Weekly Chart
Daily Chart
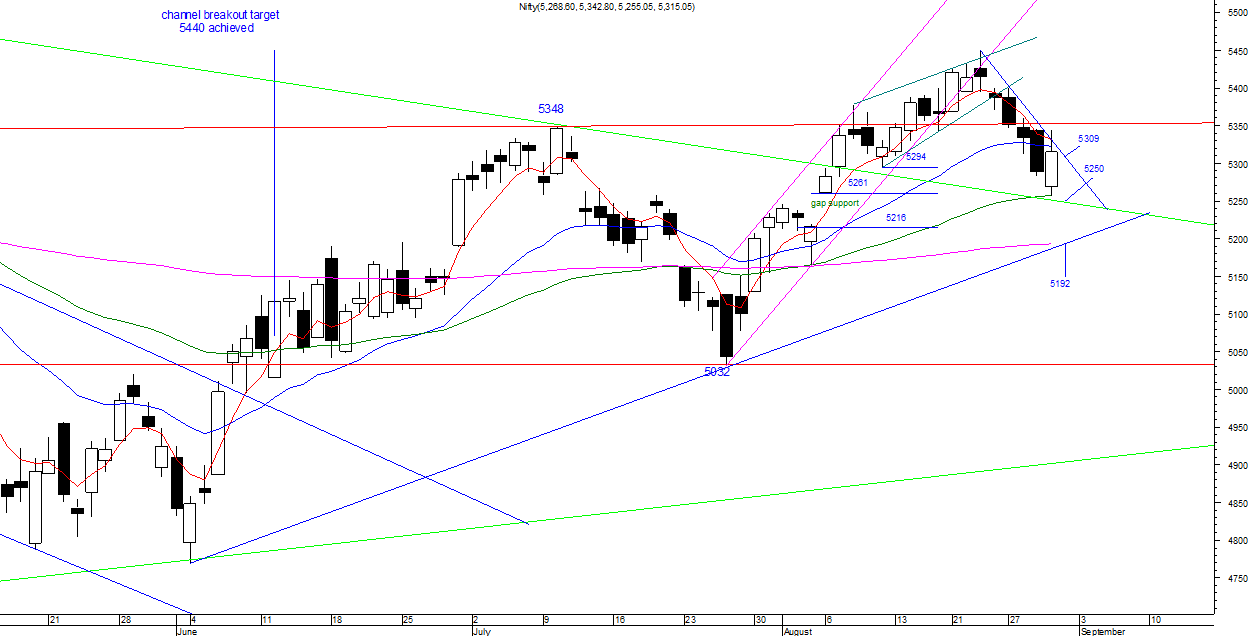
Half Hourly Chart
Weekly charts saw a third positive week in a row and maintaining the break out of the red symmetrical triangle giving a target of 6297. Breakout from the downtrendline joining 6338-5630 peaks is pending.A close above 5265 for the week will confirm this and Nifty should be on it's way to achieve the 6297 target.Oscillators are showing strength.
Daily Charts saw the Nifty break above the congestion zone of 5342-5379 but could not manage a close above the level.The breakout from the symmetrical triangle on daily charts was not celebrated since I was concentrating more on the 5342-5379 congestion zone getting cleared.It is worth mentioning now that the breakout has been held well and one should keep the bias bullish till it holds.
The pink uptrending channel has support at 5387 and breaking below this will be the first sign of weakness.Negative divergence on the OBV,Rsi14 and Macd suggest a pullback.
Half hourly charts show a break below th euptrending channel from 5032.Negative divergences continue on oscillators.Fibonacci cluster at 5305 should be good support followed by 5267-5255-5235.
follow me on twitter http://twitter.com/#!/lucksr
Happy Trading !!
Lakshmi Ramachandran
www.vipreetsafetrading.com