Om Sri Ganeshaya Namaha

Om  Sri  Ganeshaya  Namaha
follow me on twitter http://twitter.com/#!/lucksr

Monday, January 31, 2011

S&P 500 update --31st January 2011


Weekly Chart


Daily Chart


Momentum warnings vindicated by a fall wiping out 25 points. A shooting star on the weekly charts warns of more fall to come.Supports and Resistance marked on charts.


follow me on twitter http://twitter.com/#!/lucksr

Happy Trading !!
Lakshmi Ramachandran
www.vipreetsafetrading.com

Reigning the Nifty - 31st January 2011


Weekly Chart


Weekly charts have a bearish engulfing pattern after last week's weak attempts at a revival.We now have a convincing trend reversal as per the dow theory of a lower high and a lower low. The support is taken exactly at the 50 % retracement level of the 2010 rally from 4675.Strong support at 4786, low of May 2010 and 38.2% retracement level of rise from 2252 lows.
Stochastics has reached extreme oversold zone . Watch out for an uptick to signal a temporary bottom.


Daily Chart


Trend is clearly down. Strong support zone at 5400-5300. Oscillators and OBV have reached May 2010 lows at 4786.


Half Hourly Chart


The support on the falling wedge is at 5450-5430. Targets of the triangle breakout is at 5400 and the bearish head and shoulder breakout at 5230.


follow me on twitter http://twitter.com/#!/lucksr

Happy Trading !!
Lakshmi Ramachandran
www.vipreetsafetrading.com

Reigning the Bank Nifty - 31st January 2011


Weekly Chart


Weekly Chart II


A bearish candle for the week but made a higher high and higher low indicating some value buying at lower levels.Chart II shows a rising wedge with support at 10470. Staying above this level can see attempts to reach the resistance line of the wedge.11250 would be strong resistance.


Daily Chart


Since the bottom made at 10374, a sideways movement is seen within a channel with 11280 as resistance and 10490 as support. The larger downtrending channel since the top at 13304 has support and resistance at 9938 and 11231.


follow me on twitter http://twitter.com/#!/lucksr

Happy Trading !!
Lakshmi Ramachandran
www.vipreetsafetrading.com

Friday, January 28, 2011

S&P 500 update --28th January 2011


 Daily Chart


Trend still up.   Momentum though, is ringing alarm bells.  
Resistance at 1312-1315  and Supports at 1278-1271.


follow me on twitter http://twitter.com/#!/lucksr

Happy Trading !!
Lakshmi Ramachandran
www.vipreetsafetrading.com

Reigning the Nifty - 28th January 2011


 Daily Chart


Half Hourly Chart


Nifty breaks down from the green triangle, moves and closes below the 200 dema, giving a target of 5400. The head and shoulder formation gives a target of 5230.Support taken on support line shown in red on daily charts. Holding 5594 could see some pullback.

Support at 5594-5560-5500      Resistance at  5650-5700.

follow me on twitter http://twitter.com/#!/lucksr

Happy Trading !!
Lakshmi Ramachandran
www.vipreetsafetrading.com

Reigning the Bank Nifty - 28th January 2011


 Daily Chart


Supports at 10493-10373-9840   Resistance at  10970-11250


follow me on twitter http://twitter.com/#!/lucksr

Happy Trading !!
Lakshmi Ramachandran
www.vipreetsafetrading.com

Thursday, January 27, 2011

S&P 500 update --27th January 2011


Daily Chart


Breakout was on the upside . Made a new high for the rally at 1299. Resistance now at 1310 - 1314  and Support at 1290-1281-1277.


follow me on twitter http://twitter.com/#!/lucksr

Happy Trading !!
Lakshmi Ramachandran
www.vipreetsafetrading.com

Reigning the Nifty - 27th January 2011


Daily Chart


A bearish engulfing candle on good volumes.The up move from the lows of 5624 has been very weak and sluggish retracing just around 30% of the fall from 6181.Oscillators too are showing weakness struggling to cross the 50 level. The move from 5634 is in an upward channel  which could be a bear flag.Watch out for cracking of support at 5695.


Half Hourly Chart


Back below the red neckline opening up possibilities of the 5230 target. Redrawn the triangle with support at  5648-5651  and resistance at  5796-5788. Breakout from this level should guide direction for the short term.


follow me on twitter http://twitter.com/#!/lucksr

Happy Trading !!
Lakshmi Ramachandran
www.vipreetsafetrading.com

Reigning the Bank Nifty - 27th January 2011


 Daily Chart


The Bank Nifty could not close above the crucial 11161 and reacted to form a bearish engulfing pattern.Good volumes and stochastics in the over bought territory signal more selling to come.The OBV though maintains the positive divergence.The close is below the 200 dema after closing above it yesterday.


Daily Chart II


Another interpretation of the bearish engulfing pattern is , it could be panic selling byt the last of the sellers. This could be possible with an inverse head and shoulder pattern forming.Break above the neckline could then give  a rally upto the previous peak at 11912.


follow me on twitter http://twitter.com/#!/lucksr

Happy Trading !!
Lakshmi Ramachandran
www.vipreetsafetrading.com

Wednesday, January 26, 2011

S&P 500 update --26th January 2011


 Daily Chart


A megaphone formation within the rising wedge which i have been showing for quite sometime. Both bearish formations.Coiling   taking place with the larger extremes being 1296-1271  and the smaller extremes contained within 1292-1281.A breakout from the smaller range will find support / resistance at the larger range.

If the megaphone  support lines give way  then should find support on the support line of the rising wedge at 1260.


follow me on twitter http://twitter.com/#!/lucksr

Happy Trading !!
Lakshmi Ramachandran
www.vipreetsafetrading.com

Tuesday, January 25, 2011

S&P 500 update --25th January 2011


Daily Chart


61.8% of the pullback from 1296 to 1271 recovered. Strong resistance in the 1310-1313 area.

Resistance at  1296-1310-1313    Support at  1287-1282-1275.


follow me on twitter http://twitter.com/#!/lucksr

Happy Trading !!
Lakshmi Ramachandran
www.vipreetsafetrading.com

Reigning the Nifty - 25th January 2011


 Daily Chart


Half hourly Chart


Upward breakout from the triangle shown in yesterday's post has given the upward direction. Resisted at the previous top of 5747 and the 23.6% retracement level of fall from 6181. Trade above 5747-5732 tomorrow will likely have a bullish follow up.A higher high higher low formation visible on the half hourly charts seconds this view.A move upto 5870 is possible if stays above 5747.

Resistance is at 5747-5794-5836.   Support is at 5721-5676-5624.


follow me on twitter http://twitter.com/#!/lucksr

Happy Trading !!
Lakshmi Ramachandran
www.vipreetsafetrading.com

Reigning The Bank Nifty 25th Januray 2011


 Daily Chart


Resisted at the 11161 levels. The follow up buying was impressive though with a huge bullish candle third day in a row on good volumes.Break above the 11161 and 11346 is necessary for the bulls to be confident of the upmove.

Supports are at 11991-11874-10782.


follow me on twitter http://twitter.com/#!/lucksr

Happy Trading !!
Lakshmi Ramachandran
www.vipreetsafetrading.com

Monday, January 24, 2011

S&P 500 Update 24th January 2011


Weekly Chart


 Daily Chart


A slight blip this week after making a higher high and higher low for the eighth week in a row. The rising wedge  has good support at 1255.Only a fall below this level will put the uptrend in danger.

The daily charts show a break down from the uptrendline from 1174 lows.
Supports are at 1271-1267-1261. Resistance is at 1290-1296-1308.


follow me on twitter http://twitter.com/#!/lucksr

Happy Trading !!
Lakshmi Ramachandran
www.vipreetsafetrading.com

Reigning the Nifty - 24th January 2011


 Weekly Chart


Weekly Chart II


Nifty showed a stalling of the selling by forming a small bodied white candle scaling  23.6% of the earlier week's fall.
Positives are that the support line shown in red gave good support and the close was once again above the trendline joining tops since August 2010. OBV continues to  show positive divergence.The 40 wema has proved good support for the third time in the March 2009 rally.
Negatives are that oscillators continue looking  weak.This fall has been the biggest fall of the March 2009 rally raising doubts whether it is a reversal of the uptrend. Laboured recoveries are no match to the desperate falls.

Till we see more bullish candles on good volumes recovery will be suspect.In other words stay light and hedged .


Daily Chart


The daily candle was a "spinning top"  showing losing  momentum  on the downside. It formed an "Inside day"  pattern as the high of 5729 and low of 5634 of the previous candle could not be broken.If an inside day is found at the end of a prolonged downtrend ( already 10 weeks old) and is located near a level of support   ( which it is --just bounced off the 200dema  and the 40wema ), it can be used to signal a bullish shift in trend.

As per candlestick analysis this formation is called a Harami.The significance of a Harami is that it tells us that the selling has stopped. The close of the  Harami can help predict how strong the new trend  will be. If the Harami opens and closes at the very low end of the previous day's  candle, the new uptrend may be very flat or slow. An open and close midway into the previous  candle, will set a  moderately strong upmove. The  uptrend may be very strong if the harami opens and closes near the top of the previous day's  candle.

In Nifty's case the harami is midway into the previous day's candle indicating a mildly bullish rally may ensue. This is in keeping with the fact that a medium term downtrend is in place.Oscillators too have failed to show any enthusiasm.


Half Hourly Chart


The half hourly chart shows a coiling effect in the form of an equilateral triangle.Failure to scale above the red neckline keeps the possibility of the target of 5230 being attempted. The weekly and daily on the other hand show attempts of stalling the fall. This conflict is rightly depicted by the equilateral triangle which signifies indecision.

My View

The fall is getting old and thus the energy to run down is failing. Attempts of a rally  should be traded cautiously as a downtrend is in place and Nifty has to give more bullish signals for a trend  reversal.Trade light and hedged in the direction of breakout from the equilateral triangle .

Resistance on daily for the triangle is at 5701 and  Support at 5641.


follow me on twitter http://twitter.com/#!/lucksr

Happy Trading !!
Lakshmi Ramachandran
www.vipreetsafetrading.com

Reigning the Bank Nifty - 24th January 2011


Weekly Chart


A marginal lower low was made for the week but good buying support at oversold levels found the Bank Nifty recouping a major part of last weeks losses.The flag formation is intact and resistance is at 11396  and support is at 9877. 


Daily Chart


Daily charts have been showing mild bullishness as I have been mentioning all week after the doji on Monday, 17th  January.Yesterday's bullish engulfing candle had a good enough follow up, scaling and closing above the 61.8% retracement of fall from 11161.Volumes were good and breadth 1.5:1.  Efforts are on to touch the resistance line of the flag which is at 11396 for the week. Hurdles are at 11161.

Resistance is at 11161-11649-11912   and  Support is at  10800-10725-10650-10584.


follow me on twitter http://twitter.com/#!/lucksr

Happy Trading !!
Lakshmi Ramachandran
www.vipreetsafetrading.com

Friday, January 21, 2011

S&P 500 update --21st January 2011


Daily Chart


Support taken on the short term uptrendline. The candle is bullish showing good support at lower levels.Expect  bulls to take advantage of this. From the low of 1174 this is the largets pullback of 25 points. Rally to previous highs possible if the support at 1272 is held. Else expect a test of support at 1254.


follow me on twitter http://twitter.com/#!/lucksr

Happy Trading !!
Lakshmi Ramachandran
www.vipreetsafetrading.com

Reigning the Bank Nifty - 21st January 2011


Daily Chart

On Monday I wrote,   A doji at support . This could have bullish implications conveying selling is drying up.Watch if tomorrow's candle is bullish. On Tuesday I wrote, Today's candle gapped up and held well  confirming a temporary bottom at the doji low of  10374.Yesterday I wrote, A nothing day with a doji candle. However a higher high and higher low were made.

Today's candle kept up the underlying bullishness and made a bullish engulfing candle which is bullish at bottoms.The candle was on very good volumes which gives more credence to the bullishness. The Bank Nifty is up till the low of today's candle at 10493 is held.

Resistance is at 10868-10907-11161.  Support  at 10761-10688-10630-10570.


follow me on twitter http://twitter.com/#!/lucksr

Happy Trading !!
Lakshmi Ramachandran
www.vipreetsafetrading.com

Reigning The Nifty - 21st January 2011


 Daily Chart


Half Hourly Chart


The Nifty once again bounced back after breaking below the 200dema making a slightly higher high at 5634 and closing above it. The break below the red neckline shown on half hourly charts too has also been broken twice unsuccessfully. However the bullishness of the outside day was not taken advantage of and today's candle formed a lower high lower low showing not enough conviction from the bulls.

A range between 5624-5747 has been formed and a break from this range will give a move of 123 points.

Resistance at 5747-5780-5874  and Support at 5708-5686-5624.


follow me on twitter http://twitter.com/#!/lucksr

Happy Trading !!
Lakshmi Ramachandran
www.vipreetsafetrading.com

Thursday, January 20, 2011

S&P 500 update --20th January 2011

 Daily Chart


The S&P500 finally relented  and formed a bearish morning star pattern. This is bearish top reversal pattern. Only a move above the high of 1296 will negate this bearishness.Negative divergences have been persisting since some time acting as alerts for a correction.

Supports at 1272-1262-1254.  Resistance at 1285-1290-1296.


follow me on twitter http://twitter.com/#!/lucksr

Happy Trading !!
Lakshmi Ramachandran
www.vipreetsafetrading.com

Reigning the Nifty - 20th January 2011


 Daily Chart


Half Hourly Chart


Today was an outside day closing  in the negative. Outside days are  reversal days. It  is a two-period pattern that suggests a potential reversal or deceleration of the current trend. The high is higher than the previous day's high and the low is lower than the previous day's low.

The reversal  in case of  Nifty should be of the downtrend so watch out for supports holding and an upmove ensuing. The nifty has already shown bullish tendencies by bouncing off the 200 dema  forming a doji on Monday and a gap up bullish candle on Tuesday.Wednesday, i,e today has formed the Outside day.All bullish signals.

The half hourly charts however show the Nifty weak under the neckline which is at 5700.Today's efforts to break above the neckline failed. Thus only sustaining above 5700 can make the outside day pattern a success else expect further downsides towards the target of the head and shoulder pattern which is 5230.


follow me on twitter http://twitter.com/#!/lucksr

Happy Trading !!
Lakshmi Ramachandran
www.vipreetsafetrading.com

Reigning the Bank Nifty - 20th January 2011


Daily Chart


A nothing day with a doji candle. However a higher high and higher low were made.
Resistance at 10715-10775-10870-11161. Only a move above 11161 can bring in the bullish momentum.

Support at 10562-10520-10373.


follow me on twitter http://twitter.com/#!/lucksr

Happy Trading !!
Lakshmi Ramachandran
www.vipreetsafetrading.com

Wednesday, January 19, 2011

S&P 500 update --19th January 2011

 Daily Chart


Inching up , climbing the wall of worry, eluding  the  pullback  every other analyst is calling for . Negative divergence is intact on oscillators.

Resistance is now at 1305-1313  and Support at  1280-1272.


follow me on twitter http://twitter.com/#!/lucksr

Happy Trading !!
Lakshmi Ramachandran
www.vipreetsafetrading.com

Reigning the Bank Nifty - 19th January 2011


Daily Chart


Yesterday I wrote, A doji at support . This could have bullish implications conveying selling is drying up.Watch if tomorrow's candle is bullish. 

Today's candle gapped up and held well  confirming a temporary bottom at the doji low of  10374. First hurdle to be crossed at 11081-11161.


follow me on twitter http://twitter.com/#!/lucksr

Happy Trading !!
Lakshmi Ramachandran
www.vipreetsafetrading.com

Reigning the Nifty - 19th January 2011


Daily Chart


Half Hourly Chart


Yesterday I wrote " A doji was formed at the 200dema support. This could prove bullish if tomorrow's candle is positive and closes above today' close not making a new low.Doji's indicate indecision and normally signal that the current trend may be reversing.

This view is supported by positive divergences on half hourly charts.The fact that today's opening high was crossed intraday but the lows  not even visited, gives some credence to this view.Holding the 200 dema is another positive".


The Nifty made a bullish candle with a gap up and held well all day to close up by 70 points. The bounce of 200dema is bullish. However the hurdle of crossing the  downtrendline, which has been easier to draw on half  hourly charts,  at 5730-5690 is necessary to confirm short term bullishness. A close above 5750  is the another important criteria.The minor high at 5874 is the next hurdle.

Supports at 5705-5672-5637-5624.


follow me on twitter http://twitter.com/#!/lucksr

Happy Trading !!
Lakshmi Ramachandran
www.vipreetsafetrading.com

Tuesday, January 18, 2011

Reigning the Nifty - 18th January 2011


Daily Chart


 Half Hourly Chart


A doji was formed at the 200dema support. This could prove bullish if tomorrow's candle is positive and closes above today' close not making a new low.Doji's indicate indecision and normally signal that the current trend may be reversing.

This view is supported by positive divergences on half hourly charts.The fact that today's opening high was crossed intraday but the lows  not even visited, gives some credence to this view.Holding the 200 dema is another positive.

Supports are at 5598-5638  and Resistance is at 5696-5705.

follow me on twitter http://twitter.com/#!/lucksr

Happy Trading !!
Lakshmi Ramachandran
www.vipreetsafetrading.com

Reigning the Bank Nifty - 18th January 2011


 Daily Chart


 A doji at support . This could have bullish implications conveying selling is drying up.Watch if tomorrow's candle is bullish.


follow me on twitter http://twitter.com/#!/lucksr

Happy Trading !!
Lakshmi Ramachandran
www.vipreetsafetrading.com

Monday, January 17, 2011

S&P 500 update --17th January 2011

 Daily Chart


Ignoring negative divergences , the S&P 500 continues it's uptrend.

Resistance at 1303-1313.  Support at 1280-1270.


follow me on twitter http://twitter.com/#!/lucksr

Happy Trading !!
Lakshmi Ramachandran
www.vipreetsafetrading.com

Reigning the Bank Nifty - 17th January 2011


 Weekly Chart


61.8% retracement level of the last rise from 8806 to 13304  has been broken.The 23.6% retracement level of the entire rise from March 2009 has also been broken. The fall remains within the falling channel which now has support at 10050. Oscillators have broken their lows corresponding with Bank Nifty's 8150 .The 61.8% retracement level from this low is at 10135.Supports below these lows of 10135-10050  are at 9478-8806-8310-8150-7120. This would be an almost 50% fall and a good oppurtunity to start nibbling.


Daily Chart


Breakout trendline shown in red has not yet been violated.Support on it is at 10365.Positive divergence on Macd has been violated  but the positive divergence on OBV is intact.Holding these levels  can encourage bulls.

Resistance at 11080-11508-11850-12194.

follow me on twitter http://twitter.com/#!/lucksr

Happy Trading !!
Lakshmi Ramachandran
www.vipreetsafetrading.com

Reigning the Nifty - 17th January 2011


 Weekly Chart


Nifty broke key supports making a lower low on the weekly charts.Falls have been steep and rises laboured, emphasising that a downtrend is in place. If todays low at 5640 is held then we may see efforts to rise to the resistance line shown in red with a resistance at 6148 for the coming week.In between resistances are at 5676 and 5992. Support is at 5628 failing which Nifty may  test of the lower trendline of the blue channel at 5040. Support exists at previous minor low at 5349.

OBV has maintained above its November 2010 lows giving a flicker of hope that today's lows may hold.Rsi14 and Macd has broken it's corresponding low.
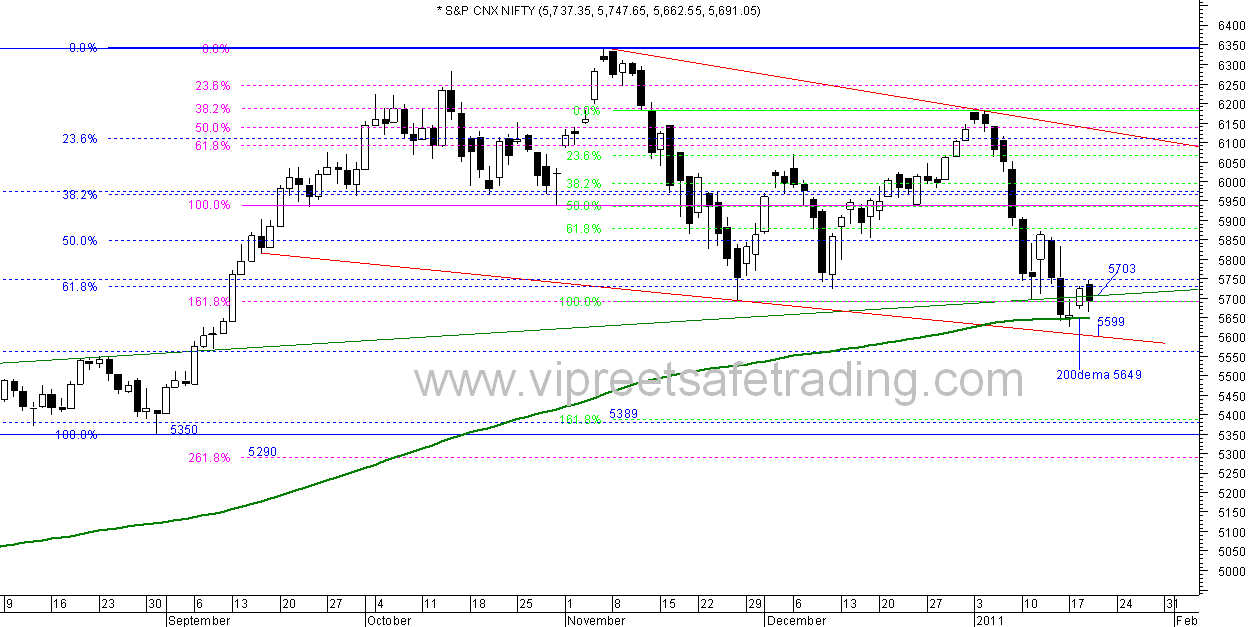


Daily Chart


Break of the earlier fibo cluster at 5730-5690 may find support at  the cluster of fibonacci supports at 5389-5380-5350-5290.Supports on trendlines at 5640-5606.Only trading above 5700 can bring some strength to the bulls.Oscillators looking very weak and nearing the oversold area.Stochastics has turned up from the oversold region indicating some bottom may be formed soon.

Resistance at  5702-5742-5767-5804-5850-5874.  Supports at 5640-5606-5560-5475


Half Hourly Chart


As anticipated yesterday , the pennant broke down leading to a break below the neckline giving rise to the possibility of a fall to around 5200.Immediate efforts from bulls pulling Nifty back above 5874, the high made on the last pullback, could lead to strengthening the bulls.Bullish hammer occuring at the temporary bottoms, marked on the chart by the bull figure,has led to good pullbacks.We may therefore watch for a pullback on Monday.Positive divergences on half hourly oscillators support the pull back.


follow me on twitter http://twitter.com/#!/lucksr

Happy Trading !!
Lakshmi Ramachandran
www.vipreetsafetrading.com