Om Sri Ganeshaya Namaha

Om  Sri  Ganeshaya  Namaha
follow me on twitter http://twitter.com/#!/lucksr

Friday, April 30, 2010

Reigning The Nifty - 30th April, 2010


 Daily Chart


Half Hourly Chart


The Nifty is yet stuck within the 5160-5400 range. Inside day on daily suggests skepticism about continuation of the upmove. The first signs of the upmove continuing would be trade above 5290 .

Wait for scaling of Resistance at 5317-5322 for longs  and break of Support at  5208-5213 for shorts.


Happy Trading !!
Lakshmi Ramachandran
www.vipreetsafetrading.com

Thursday, April 29, 2010

Reigning The Nifty - 29th April, 2010


Half Hourly Chart


Daily Chart


Daily Line Chart


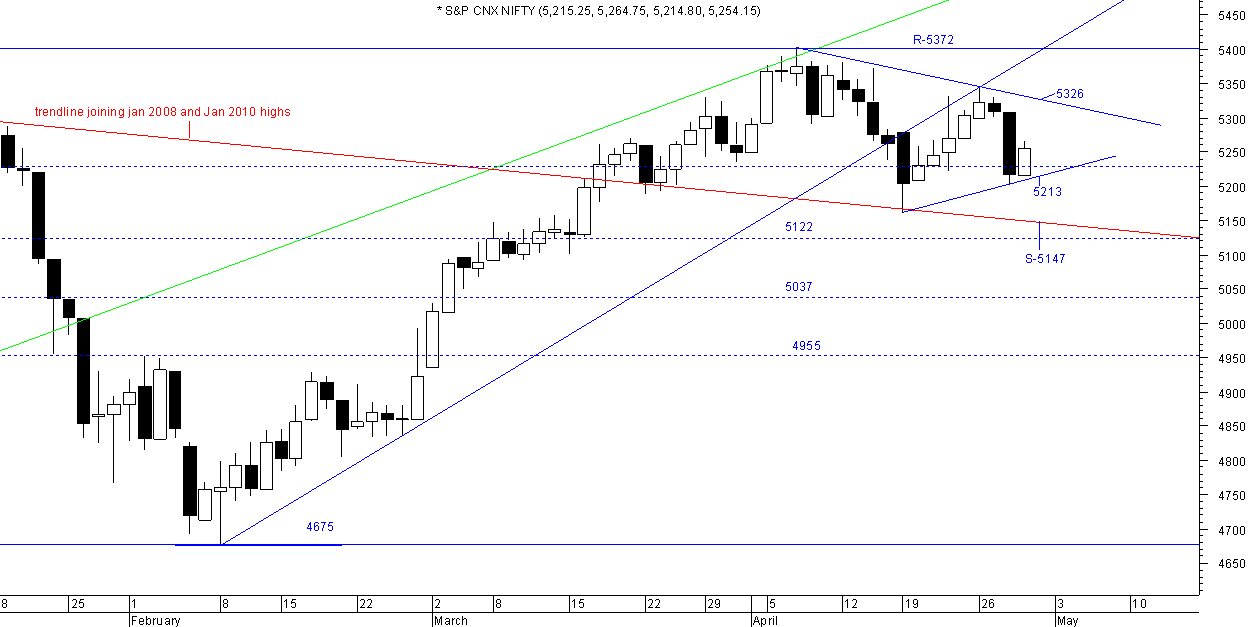
I mentioned yesterday, " Yesterday's high and low become turning points tomorrow. The break of rising wedge points at breaking the low of 5299."  The Nifty broke below the level to form a huge bear candle closing below the 61.8% level shown on half hourly charts. The AD line plunged.Volumes were the largest since last 7 days.

Rising wedge target is 5130 .Good supports at 5150 and 5120 shown on half hourly charts.5160 is the latest low made on 19th April. These levels should offer good support .

On daily line charts 5200 is significant support and a close below this level would give a target of 5025. the 50 % retracement of rise from 4675 to 5400 is at 5037.

Among daily oscillators, Rsi 14 has broken it's low made when the Nifty made the low of 5160.This points to the possibility of 5160 being broken.Macd made a downtick and stochastics moving lower after giving a sell.

Till  the low of 5160 is broken the trend is up. However , a lot of  weakening signals cropping up cannot be ignored. One can be on the short side but appropriately hedged till the trend turns down technically.

Happy Trading !!
Lakshmi Ramachandran
www.vipreetsafetrading.com

Wednesday, April 28, 2010

Reigning The Nifty - 28th April, 2010


 Daily Chart


Half Hourly Chart


  • Inside day keeping within the range of previous day of  5342-5299.
  • Failed to move above the trendline from which it broke down --shown on daily chart.
  • Broken down from rising wedge shown on half hourly charts.
  • Daily oscillators have mader lower highs and starting to move down.
  • Half hourly oscillators are not showing strength too.
  • Emas on all time frames bullishly aligned.
Yesterday's high and low become turning points tomorrow. The break of rising wedge points at breaking the low of 5299.Expect a test of the trendline joining Jan 2008 and Jan 2010 trendline shown in red.

An upmove would require the Nifty to trade more robustly  above  5370-5400.

Long or Short remain hedged till more clarity on direction of the Nifty.


Happy Trading !!
Lakshmi Ramachandran
www.vipreetsafetrading.com

Monday, April 26, 2010

Reigning The Nifty - 27th April, 2010


Daily Chart


Half Hourly Chart


  • A bullish candle resisting exactly on the down trendline from 5400 top.
  • Volumes were very low and breadth almost 1:1
  • Daily oscillators strong and all emas bullishly aligned.
  • Half hourly oscillators neutral and emas bullishly aligned.
All indicators are once again bullish.However till 5400 is crossed decisively the fear of the fall resuming looms.Resistances between 5300-5400 are many.  Breaking above 5334 will be a breakout from the downtrending channel and could lead to upsides, but one needs to be very careful in trading the breakout till 5400 is taken out. The nifty has taken support at 5316 thrice today and violation of this level could be the  first sign of weakness.Supports at 5278-5154.

Suggesting a directional strategy at this juncture is difficult.Longs may keep a stop loss of 5278 and shorts a stop loss of 5400.


Happy Trading !!

Lakshmi Ramachandran
www.vipreetsafetrading.com

Saturday, April 24, 2010

Reigning The Nifty - 26th April, 2010


 Weekly Chart


  • Weekly  lower high and lower low continued for the second week .
  • The candle for the week is a bullish candle showing good support at lower levels.
  • Volumes were high and breadth mildly positive.
  • Rsi 14 and Macd still showing strength but stochastics is moving down from overbought levels.
  • 5167 is support on uptrendline from march 2009 lows , coinciding with the week's low of 5161, making it a significant support.


Daily Chart I

 Daily Chart II


  • Closed above the range of 5160-5279 making a higher low for the fourth consecutive day .
  • The close was above all short term demas  which is bullish., and barring the 5 and 10 demas all are bullishly aligned.
  • Oscillators are showing strength once again, moving abup above the 50 level, though Macd is in sell but shown an uptick.
  • 5264 is good support coinciding with the 20 dema at 5262.
  • 5200 is good support on line charts. So a close below 5200 would be bearish.


Half Hourly Chart


  • Half hourly line charts close above   the 61.8% level, opening the possibility of testing the 100% level at 5385.
  • Oscillators are showing strength. 
  • Emas are all bullishly aligned once again.
  • Rising wedge formation on the rise from 5161.

 
The inability to reach the upper trendline of the channel shown on weekly charts is called "return failure" and is considered bearish. The failure to reach a channel line provides warning that the current trend is losing strength. If, on the other hand, nifty breaks out of the channel line, it is a sign the current trend is accelerating.
Thus , till the earlier high of 5400 or the upper trendline of the channel is crossed, Nifty could move lower. However ,  the Nifty could continue to move up till the low of 5160 is held.In short, expect whipsaws till the range is broken.

Support at 5265-5160 and Resistance at 5340-5350-5400.Place stops on short/long positions accordingly.


Happy Trading !!

Lakshmi Ramachandran
www.vipreetsafetrading.com

Thursday, April 22, 2010

Reigning The Nifty - 23rd April, 2010

 Daily Chart


 Daily Chart II


Half Hourly Chart


 Extremely volatile day leaving both bulls and bears whipsawed.The nifty broke the inside day range of 5279-5160 but closed within the  range .Like I said yesterday markets are in a flux and directional trading will be diffficult till nifty finds direction.

Daily oscillators are moving up and  and the half hourly oscillators have moved down from overbought region due to the sharp sell off in the last hour.

Low of 5160 is still held.This supports continuation of the upmove from 5160.However keep in mind that today's action could be the forming of the right shoulder in the bearish head and shoulder pattern with the green neck line. The bearish rising wedge forming supports the view that the right shoulder may indeed be forming.

Support on the lower trendline of the rising wedge at 5245-5268 and on the neckline at 5157.  Resistance is at 5332-5344 as shown on the daily charts.

Long or short be hedged so that  losses are minimum. Time to give more importance to risk management.
 

Happy Trading !!

Lakshmi Ramachandran
www.vipreetsafetrading.com

Wednesday, April 21, 2010

Reigning The Nifty - 22nd April, 2010

 Daily Chart I


 Daily Chart II


 Half Hourly Chart


Nifty remained withing the range of the Inside day though it was a higher high and higher low than yesterday.Markets are in a flux and traders are getting whipsawed.Intraday charts are showing the latest action as an inverted head and shoulder pattern with the neckline at 5255-5260 for tomorrow. Break above it will give a move of about a 100 points.

The move since mid March shows a bearish head and shoulder pattern with neckline support at 5156 for tomorrow. Break below it will take the Nifty close to 4900 levels.

Daily oscillators are showing strength. and so are the half hourly oscillators. Moving averages as mentioned yesterday continue to be bearishly aligned.The pull back could continue till 5161 is held.

Resistances and Supports as marked on the charts.Strong resistance at 5300-5320 and strong support at 5155-5160.

Happy Trading !!

Lakshmi Ramachandran
www.vipreetsafetrading.com

Tuesday, April 20, 2010

Reigning The Nifty - 21st April, 2010


Daily Chart I


Daily Chart II


Half Hourly Chart


 Half Hourly Bar Chart


  • An Inside day showing indecision.
  • Close exactly at 5230, the resistance level shown on the falling wedge yesterday. 
  • The 5,10 and 20 dema are bearishly aligned indicating short term could continue to be bearish.  
  • All moving averages on the half hourly charts are bearishly aligned.
  • Daily oscillators show further selling could come in.The stochastics however has given a buy in the oversold region.
  • Half hourly charts show formation of a bear flag in the run up from 5161.
  • Half hourly oscillators are in the neutral zone.
  • Breadth was extremely good and so was the volumes.
The half hourly bar chart shows Nifty to have taken support on a very significant level which has been support and resistance several times.Further the Nifty took support at the 50dema and the trendline joining Jan 2008 and 2010 levels. This makes holding  5161 crucial for  the nifty  to move up to higher levels.The falling wedge shown on daily charts is bullish and a breakout could mean further upmove.

The Nifty needs to trade above 5221 for a breakout from the  redrawn wedge.The bear flag shown on half hourly charts has supports at 5219-5252 for tomorrow.Break from these supports will lead to test of 5161 and on break of 5161, seek lower levels.

The immediate trigger is the break  of  the Inside pattern's high of 5279 or  low of 5161. Longs can keep a stop loss of 5161 and shorts a stop loss of 5279.

    Happy Trading !!

    Lakshmi Ramachandran
    www.vipreetsafetrading.com

    Monday, April 19, 2010

    Reigning The Nifty - 20th April, 2010

     Daily Chart


    Half Hourly Chart


    • Bearish candle taking support on the 50 dema and the downtrendline joining tops of Jan 2008 and 2010.
    • Falling wedge on daily charts which is bullish.
    • Daily oscillators weak, Rsi 14 below 50 level and stochastics in oversold area.
    • Half hourly charts show movement in a steep down trending channel .
    • Positive divergence seen in half hourly oscillators.
    Bounce from the 50 dema and  the downtrendline joining tops of Jan 2008 and 2010 could continue. Positive divergence on half hourly charts supports this.

    Resistance at 5230  and support at 5139.

    The short term trend is down and one should look to go short on rallies till 5400 is taken out.

    Happy Trading !!

    Lakshmi Ramachandran
    www.vipreetsafetrading.com

    Saturday, April 17, 2010

    Reigning The Nifty - 19th April, 2010


     Weekly Chart


    Daily Chart I


    Daily Chart II


    Half Hourly Chart


    Weekly Charts
    • Broken trendline joining lows since 4675 making a lower high lower low after 9 weeks.
    • Oscillators moving down after negative divergence.
    • Support at 5121 on trendline joining March 2009 and February 2010 lows.
    • Fall was on low volumes.
    Daily Chart
    • Fall continued but found support at previous low of 5235 on negative breadth but on low volumes.
    • Candle formed has long lower shadow indicating support at lower levels.
    • Stochastics is in oversold zone and Rsi 14 and OBV have broken all supports made during the rally from 4675.
    • 50 dema support at 5166 which coincides with support at trendline joining Jan 2008 and Jan 2010 highs.
    Half  Hourly Charts
    • Decending triangle formation indicating support at 5235 may be violated.
    • Oscillators moving up from oversold zone indicating the pullback may test the upper trendline of the decending triangle.
    • The pullback has started forming a bear flag.

    The rally from 4675 is declared over.The trend will be declared down only if 4675 is broken. However, weight of evidence supports a correction till 5400 is crossed. 5122 is very strong support as it is the 38.2% fibo level of rise from 4675 to 5400 and is weekly support on trendline joining March 2009 and February 2010 lows.

    Daily stochastics at oversold zone and intra day oscillators moving up from oversold zone support a pullback.Long lower shadow at 5235 support gives weight to this view.

    Sell on rallies strategy continues.


    Happy Trading !!

    Lakshmi Ramachandran
    www.vipreetsafetrading.com

    Thursday, April 15, 2010

    Reigning The Nifty - 16th April, 2010


     Daily Chart I


    Daily Chart II


    Half Hourly Chart


    Yesterday i had observed, "Nifty is on the lower end of the green triangle shown on half hourly charts.Thus if Nifty remains above 5300 we may have a test of  5360-5370.Daily oscillators including the OBV have broken below the respective lows made when Nifty made the low at 5049 indicating the Nifty may correct further".


    The range between 5383 and 5290 was finally broken on the downside after touching the resistance at 5673, confirming the bearishness of the channel break shown on daily charts. The immediate target is of 5180 . Suppports close to this level are  at 5187 and  5167. A fall below these levels can accelerate the correction.

    The up trendline shown on daily chart I has support at 5262 for tomorrow. If this level holds then the uptrend may resume. The 20dema too supported nifty perfectly at 5268.

    Daily oscillators support  a fall but half hourly oscillators have reached extreme oversold zone.Sell on rallies till 5400 is crossed .


    Happy Trading !!

    Lakshmi Ramachandran
    www.vipreetsafetrading.com

    Wednesday, April 14, 2010

    Reigning The Nifty - 15th April , 2010


     Daily Chart


    Daily Chart II


    Half Hourly Chart

    • The Inside day range remained unbroken, leaving traders confused about the direction of the immediate trend.
    • Daily oscillators including the OBV have broken below the respective lows made when Nifty made the low at 5049 indicating the Nifty may correct further.
    • Half Hourly oscillators are in neutral zone.
    • The fall since Nifty touched 5400 has been at a very slow rate on very low volumes which favours an upmove after the consolidation. 
    • Nifty is on the lower end of the green triangle shown on half hourly charts.Thus if Nifty remains above 5300 we may have a test of  5360-5370.
    Nifty has been in a sideways move since hitting 5400. Only a break above this level or a break below 5290 will give direction. Supports are at 5290-5255-5235 and resistance at 5370-5383-5400-5450.
       
      Happy Trading !!

      Lakshmi Ramachandran
      www.vipreetsafetrading.com

      Monday, April 12, 2010

      Reigning The Nifty - 13th April , 2010

       Daily Chart


       Half Hourly Chart


       The Inside day range was left untouched, forming a small bodied candle on very low volumes . Breadth was marginally positive. The up trending channel shown on the daily charts has been broken once again increasing chances of a top having been formed at 5400. On half hourly charts too the triangle was broken on the downside.

      Oscillators on half hourly charts are in neutral territory and not showing much strength.Daily oscillators are moving lower after showing negative divergence.Macd has given a sell. The Nifty has taken support twice at the 5325 level today. Expect weakness only below this level.

      One may be cautiously long on the markets as the trend still remains up though signs of tiring are showing up.Weekly charts show resistance at 5458. Stop loss to continue at 5290.

      Happy Trading !!

      Lakshmi Ramachandran
      www.vipreetsafetrading.com

      Sunday, April 11, 2010

      Reigning The Nifty - 12th April , 2010


      Weekly Chart


       Daily Chart


       Daily Chart II


      Half Hourly Chart


      Weekly Charts
      • Bullish candle shows continuing uptrend for the9th week on good volumes and improving positve breadth.
      • Stochastics has given a sell in the overbought zone.
      • Macd in buy.
      • Rsi 14 below 70 level but finally crossed it's earlier peak of Jan 2010.
      Daily Charts
      • Inside day pattern showing indecision.
      • Negative divergences in oscillators stochastics  Roc 12 and Rsi 14.
      • 5291 first support and 5235 second strong support.
      • High of inside day pattern 5383 and low 5290.
      Half Hourly Chart
      • Maintained within channel shown
      • Oscillators moved up from oversold zone and now in neutral territory.

      The weekly charts show continuation of the uptrend. On daily charts, Nifty has formed an Inside pattern and only price action can confirm whether there will be an upward breakout or downward. Half hourly chart shows the support from the channel at 5305-5315 and resistance at 5407-5416 for the 12th April.

      The trend is still up and if one must trade then it must be on the long side with a stop loss of 5290.


        Happy Trading !!

        Lakshmi Ramachandran
        www.vipreetsafetrading.com

        Thursday, April 8, 2010

        Reigning The Nifty - 9th April , 2010


        Half Hourly Chart


        Daily Chart I


        Daily Chart II


        Yesterday I mentioned,

        "Second successive doji  which has formed an outside day  (a higher high  and a lower low than the previous day).  If it occurs after a market has had a big move, it is often taken as a signal that momentum is waning for that move.This applies to the Nifty as the uptrend is 7 weeks old. 

        Nifty corrected today making a lower high and low and wiping out gains of the last three trading sessions.The close was at the low of the day showing extreme weakness.The uptrending channel shown on daily charts has been broken. Volumes were average and breadth negative . Daily oscillators have started moving down from overbought region after showing negative divergence.Daily Chart II shows trendline support at 5227. This coincides with earlier support at 5235 and the 23.6 % retracement shown on Chart I at 5233.

        Half hourly charts show the nifty taking support exactly at the lower trendline of the channel shown. Oscillators have reached oversold zone. Supports are strong at 5230 area. We may expect a bounce at these levels.

         
        Happy Trading !!

        Lakshmi Ramachandran
        www.vipreetsafetrading.com

        Wednesday, April 7, 2010

        Reigning The Nifty - 8th April , 2010


         Daily Chart


         Daily Chart II


         Half Hourly Chart


        Second successive doji  which has formed an outside day  (a higher high  and a lower low than the previous day).  If it occurs after a market has had a big move, it is often taken as a signal that momentum is waning for that move.This applies to the Nifty as the uptrend is 7 weeks old. 

        Oscillators on daily charts are overbought and showing negative divergence. Intraday oscillators are in neutral zone.Volumes were marginally higher than average and breadth positive.The upper trendline of the channel shown on half hourly charts has proved resistance since the last two trading sessions increasing the possibility of Nifty correcting to touch the lower trendline.Refer daily chart II for levels where I have redrawn the channel  . This makes 5317 very important support. Resistance on the way up is at 5414-5487.


        Trend is up but one may keep a stop loss of 5317 on existing longs to protect profits.


        Happy Trading !!

        Lakshmi Ramachandran
        www.vipreetsafetrading.com

        Tuesday, April 6, 2010

        Reigning The Nifty - 7th April , 2010


        Daily Chart


        Half Hourly Chart

        • Doji star at resistance of 5385 on daily charts ,  ringing alarm bells.
        • Volumes were marginally higher and breadth though positive , did not impress.
        • Daily oscillators are in negative divergence.
        • Half hourly oscillators have turned down from overbought zone.
         A higher high and higher low keeps the trend up. However , the doji star which is a reversal pattern makes one cautious. The doji star pattern consists of,
        1. 1st day is a long white day.
        2. 2nd day is a doji day that gaps above the 1st day.
        3. The doji shadows shouldn't be excessively long.
        A strict  stop loss of  5287 (10 dema) -5291 (low of bullshi candle of 5th April)  should be maintained on longs.

        Happy Trading !!

        Lakshmi Ramachandran
        www.vipreetsafetrading.com

        Monday, April 5, 2010

        Reigning The Nifty - 6th April , 2010


        Daily Chart

        Half  Hourly Chart


        • Huge bullish candle on average volumes and extremely good breadth.
        • Negative divergence continues on daily oscillators.
        • Half hourly oscillators have reached over bought zone.
        • Strong  resistance at 5385 as shown on daily and half hourly charts.

        Yesterday I mentioned, A test of the recent top of  5330 is possible due to improving technicals in the very short term. Breadth improved considerably on the last trading day.Crossing 5330 could lead to further upside, levels marked on charts.

        Nifty hesitated at 5330 for sometime but once that level was crossed, it was cakewalk. Strong resistance at 5385 needs to be crossed to achieve targets shown on weekly charts of 5428-5447.

        Stop loss for longs now at 5235.


        Happy Trading !!

        Lakshmi Ramachandran
        www.vipreetsafetrading.com