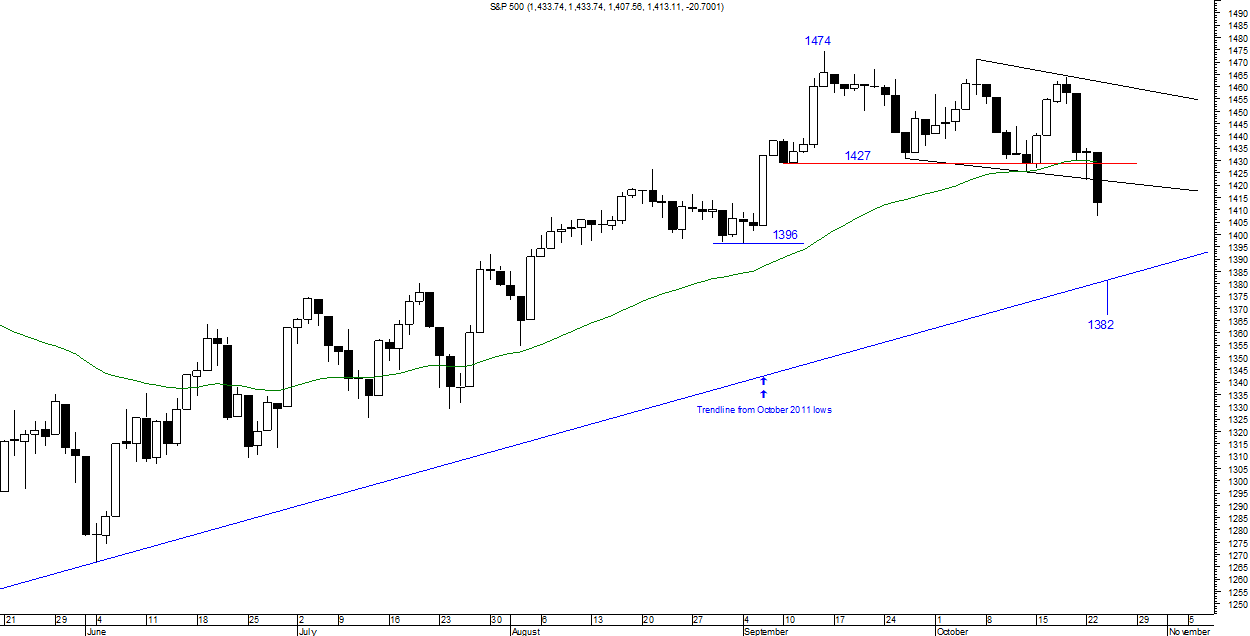
Weekly Chart

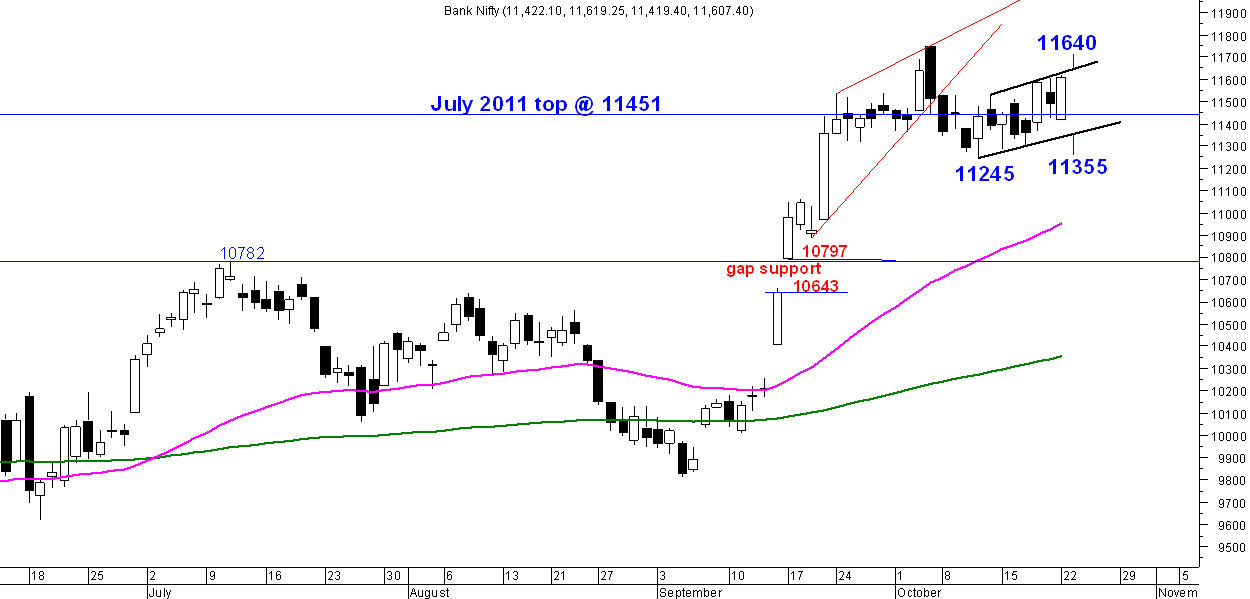
Daily Chart

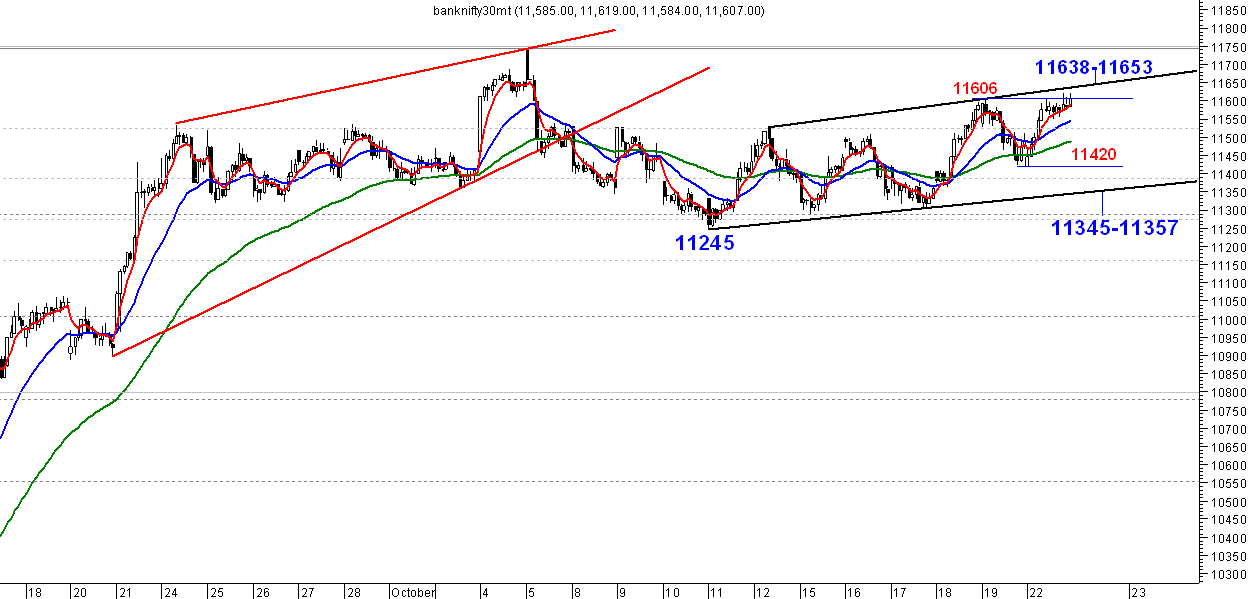
Half Hourly Chart

Range break still anticipated. However the bias was bearish with the Nifty moving down close towards the 5635 support. The 20 day ema which was good support till now has been broken and Nifty closed below it marginally.This has given the bears an upper hand and the chances of breaking the 5635 support is high.Nifty may find support at 5525 which is the gap area support.
However a break above 5725 will see Nifty testing 5815.
Supports and resistance levels are marked on charts.
follow me on twitter http://twitter.com/#!/lucksr
Happy Trading !!
Lakshmi Ramachandran
www.vipreetsafetrading.com