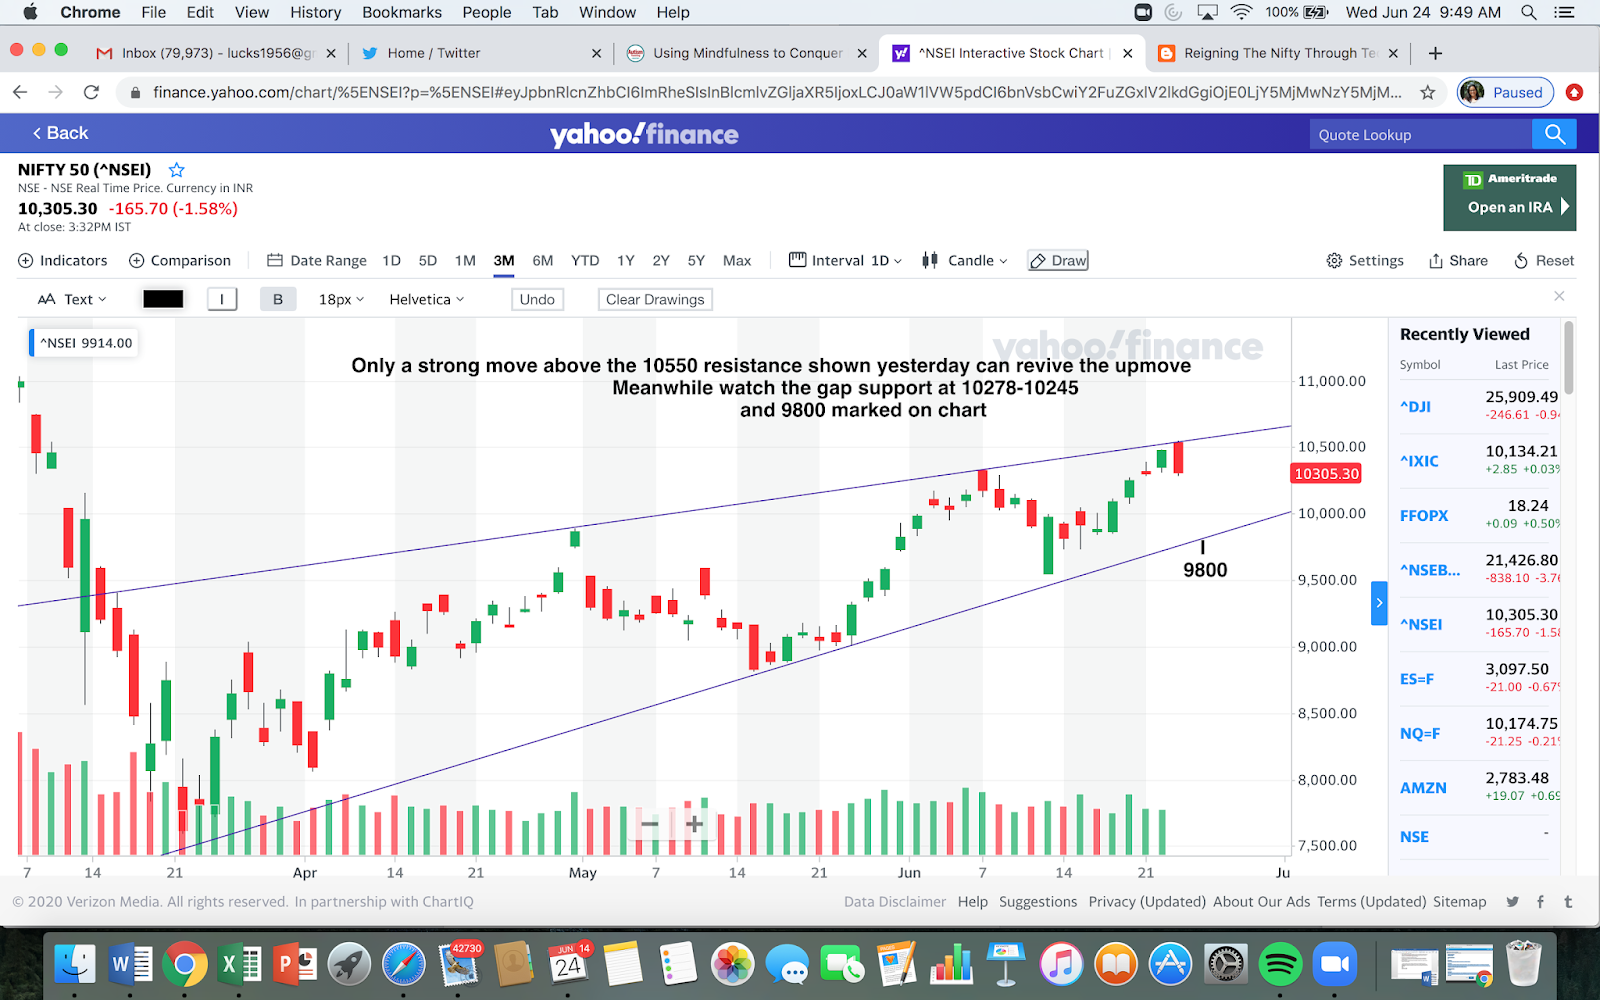
Om Sri Ganeshaya Namaha

Om  Sri  Ganeshaya  Namaha
follow me on twitter http://twitter.com/#!/lucksr

Tuesday, June 30, 2020

Doji on Nifty and Bank Nifty


Nifty Daily Chart 


 Bank Nifty Daily Chart


Dojis on both Nifty and Bank Nifty with a lower low and high continuing with the negative outlook.

Gap on Nifty today was 10383-10338  and Bank Nifty 21592-21440 if closed then may see an attempt to move up again with resistance as marked.


follow me on twitter http://twitter.com/#!/lucksr


Happy Trading !!


Lakshmi Ramachandran

Sunday, June 28, 2020

Bank Nifty Update


Weekly Chart

  
Weekly Chart II


 Daily Chart 


   Half Hourly Chart 


 Bank Nifty has desperately tried moving up but already seems to be tiring as indicated by negative divergences.A move below 20925 may start a move down.


follow me on twitter http://twitter.com/#!/lucksr


Happy Trading !!


Lakshmi Ramachandran

Nifty May Face Multiple Resistances


Weekly Chart 


Daily Chart


 Nifty is approaching a high resistance area and candles on the weekly - spinning top - and on the daily -small bodied candles after a bearish engulfing pattern on the 24th of June- point to hesitation by bulls to continue the upmove.

A close below 10194 will see more weakness.


Hourly Chart 


The hourly chart favours the bears with a rising wedge.

 
Only a clear move above the resistance areas marked on the charts will clear the way for an easy upmove.Till then caution to the Bulls.


follow me on twitter http://twitter.com/#!/lucksr

Happy Trading !!

Lakshmi Ramachandran

Wednesday, June 24, 2020

Bearish Engulfing Candle on Bank Nifty


Daily Chart 


follow me on twitter http://twitter.com/#!/lucksr


Happy Trading !!

Lakshmi Ramachandran

Nifty Reacts from Resistance as Expected


Daily Chart 


follow me on twitter http://twitter.com/#!/lucksr


Happy Trading !!

Lakshmi Ramachandran

Tuesday, June 23, 2020

Bank Nifty Clears Previous Top


Daily Chart 


follow me on twitter http://twitter.com/#!/lucksr


Happy Trading !!


Lakshmi Ramachandran

Strong Resistance Ahead


Daily Chart  


follow me on twitter http://twitter.com/#!/lucksr


Happy Trading !!


Lakshmi Ramachandran

Monday, June 22, 2020

Shooting Star


Daily Chart 


Nifty formed a shooting star candle after a gapup open.The shooting star is a bearish candle and the bulls need to keep a strict vigil for the gap support to stay strong for the move to continue.


follow me on twitter http://twitter.com/#!/lucksr


Happy Trading !!


Lakshmi Ramachandran

Friday, June 19, 2020

An Update


Nifty Daily Chart 


 Bank Nifty Daily Chart 


follow me on twitter http://twitter.com/#!/lucksr

Happy Trading !!

Lakshmi Ramachandran

Thursday, June 18, 2020

Bank Nifty Update


Daily Chart 


Today's bullish green candle supports bulls and we may expect a breakout of the 21967 resistance failing which it's back to bears breaking the 19507 support for a further meltdown.


follow me on twitter http://twitter.com/#!/lucksr


Happy Trading !!


Lakshmi Ramachandran

Nifty Shows Consolidation


Daily Chart 


Nifty moved strongly above the 9889 mark - shown by horizontal green line - with a bullish green candle indicating bulls stronger than bears in this sideways tussle.The rising wedge may restrict the upmove at 10500 and only a move above it will clear the path for a good upmove else watch for support at 9700 for a meltdown to start.


follow me on twitter http://twitter.com/#!/lucksr


Happy Trading !!


Lakshmi Ramachandran

Tuesday, June 16, 2020

Nifty Update


Daily Chart 


follow me on twitter http://twitter.com/#!/lucksr


Happy Trading !!

Lakshmi Ramachandran

Bank Nifty Update


Daily Chart 


follow me on twitter http://twitter.com/#!/lucksr


Happy Trading !!


Lakshmi Ramachandran

Nifty Update


Daily Chart 


follow me on twitter http://twitter.com/#!/lucksr


Happy Trading !!

Lakshmi Ramachandran

Saturday, June 13, 2020

Nifty Update


Daily Chart 


The uptrendline from 7511 lows and horizontal line at 9889 was superbly held indicating there may be some upmove left.

Low made at 9544 should be a good stop for longs.


follow me on twitter http://twitter.com/#!/lucksr


Happy Trading !!


Lakshmi Ramachandran

Bank Nifty Update


Daily Chart 


Status quo.Wait for break and close above 21967  or below 19526 for a clear trend to emerge.


follow me on twitter http://twitter.com/#!/lucksr


Happy Trading !!


Lakshmi Ramachandran

Thursday, June 11, 2020

Bank Nifty Update


Daily Chart 


follow me on twitter http://twitter.com/#!/lucksr


Happy Trading !!

Lakshmi Ramachandran

Nifty Update


Daily Chart 


follow me on twitter http://twitter.com/#!/lucksr


Happy Trading !!


Lakshmi Ramachandran

Wednesday, June 10, 2020

Nifty Teasing


Daily Chart 


follow me on twitter http://twitter.com/#!/lucksr


Happy Trading !!


Lakshmi Ramachandran

Tuesday, June 9, 2020

Bullish only above 11000 !


Daily Chart 


Bank Nifty has been one of the weak sectoral indices having failed to cross even the 38.2% retracement level.

Only a cross above the recent high of 10967, 38.2% fibonacci level and the round 11000 mark will bring in some upmove else expect it to move sharply down again.


follow me on twitter http://twitter.com/#!/lucksr


Happy Trading !!


Lakshmi Ramachandran

Nifty Update


Daily Chart 


Possibility of the fall resuming increases with a second day of weakness. Trendlines drawn this way form a rising wedge which is also bearish.A breakout from it to the upside is necessary to resume uptrend.Level for breakout tomorrow is around 10385.

Fall below the uptrendline from 7511 lows will see the fall strengthening.


follow me on twitter http://twitter.com/#!/lucksr


Happy Trading !!


Lakshmi Ramachandran

Saturday, June 6, 2020

Nifty May Be Taking a Breather


Weekly Chart 


 Daily Chart 


A breakout above previous high at 9889 and the lows made in 2018 around 10000 represented by the red horizontal line has held well, and may well proceed towards the targets of 12300 mentioned in my earlier posts.

 Nifty is now in a higher high higher low sequence indicating an upmove in process till we break a low made which now is at 9945.Gap support is at 9707-9580. 


follow me on twitter http://twitter.com/#!/lucksr


Happy Trading !!

Lakshmi Ramachandran

Bank Nifty


Weekly Chart 


 Daily Chart 


 Half Hourly Chart 


A move above 21967 is required to continue bullishness.

Supports are at low made at 20317 and gap at 19633-19297.


follow me on twitter http://twitter.com/#!/lucksr


Happy Trading !!


Lakshmi Ramachandran

Thursday, June 4, 2020

A Breather ?


Daily Chart 


A doji second day in a row at the strong resistance indicates mild weakness. 


 Daily Chart


A test of 9889 will be healthy for the upmove. However, a close below 9889 will see a test of the red uptrendline from 7511 lows.


follow me on twitter http://twitter.com/#!/lucksr


Happy Trading !!

Lakshmi Ramachandran

Classic Example of a Shooting Star


Daily Chart 


Bank Nifty made a classic "Shooting Star" yesterday and confirmed it's bearishness today.

The shooting star candlestick is a chart formation consisting of a candlestick with a small real body, and a large upper shadow. This pattern represents a potential reversal in an uptrend. Appearing at resistance makes it all the more reliable as in the case of Bank Nifty.

Only a strong move and close above the Shooting star will negate the bearishness.


follow me on twitter http://twitter.com/#!/lucksr


Happy Trading !!


Lakshmi Ramachandran

Wednesday, June 3, 2020

Bank Nifty Showing Waning Signs


Daily Chart 


A shooting star at resistance from earlier high at 21967 shows profit booking by bulls.

Bearishness will be confirmed if tomorrow's candle closes below the low made today. 

Time to be on the back foot.


follow me on twitter http://twitter.com/#!/lucksr


Happy Trading !!


Lakshmi Ramachandran

Breakout From Cup and Handle Pattern

Daily Chart I


Daily Chart II


Nifty broke out successfully abobe the cup and handle pattern opening up possibilities of a target of 12300.The ride so far seems to have been one way and the Nifty has closed a few points above the 50% retracement level.

We may expect a few bumps at 61.8% of the entire fall at 10561 and the resistance line of the expanding triangle.
Booking profits on the rise is recommended.


follow me on twitter http://twitter.com/#!/lucksr 


Happy Trading !!


Lakshmi Ramachandran

Tuesday, June 2, 2020

Nifty Bullish Within a Bearish Trend


Daily Chart 


A cup and handle pattern is visible in the upmove from 7511. A break sustaining above 50% retracement at 9971 will have a technical target of 12300.
A move below 8800 would negate the upmove.


Daily Chart


The upmove from 7511 is also an expanding triangle so need to be vigilant about resistance at the upper trendline from where the next leg down could start.


Conclusion : Nifty is in a short term bullish move,  within the longer term bearish trend. 
The trend is your friend so be bullish now but keep vigil of the bear closing in !


follow me on twitter http://twitter.com/#!/lucksr


Happy Trading !!


Lakshmi Ramachandran