Om Sri Ganeshaya Namaha

Om  Sri  Ganeshaya  Namaha
follow me on twitter http://twitter.com/#!/lucksr

Sunday, September 30, 2012

Wanna Shop With Me ? Part II


Last September I invited you to shop with me and Nishit and I are very happy that we made a 47% .We have come up with new ideas which we call "Top Ten Picks for All Seasons"

Here is a testimony from one of our subscribers, Gaurang Jhaveri. He says :

 "I salute the Vipreet's Safe Trading Pvt.Ltd. Team - Lakshmi Mam and Nishit for their excellent in depth knowledge in identifying value scripts. Only a WIZARD or a GURU can deliver such recommendations. They are doing a valuable service for individual investors all over. In today's competitive and busy world, I really appreciate their willingness and passion to frequently share such excellent insights of market behavior and investment strategies. Honesty, transparency and integrity are the values that keep resurfacing in the back of my head when I think of Vipreet's Safe Trading Pvt.Ltd. All I can say is that its been a privilege to be associated with Vipreet's Safe Trading Pvt.Ltd.."

Thank you Gaurang. We really appreciate your views and feel satisfied that we have helped you have a good experience with us.It is our passion with which we work to achieve what we have.

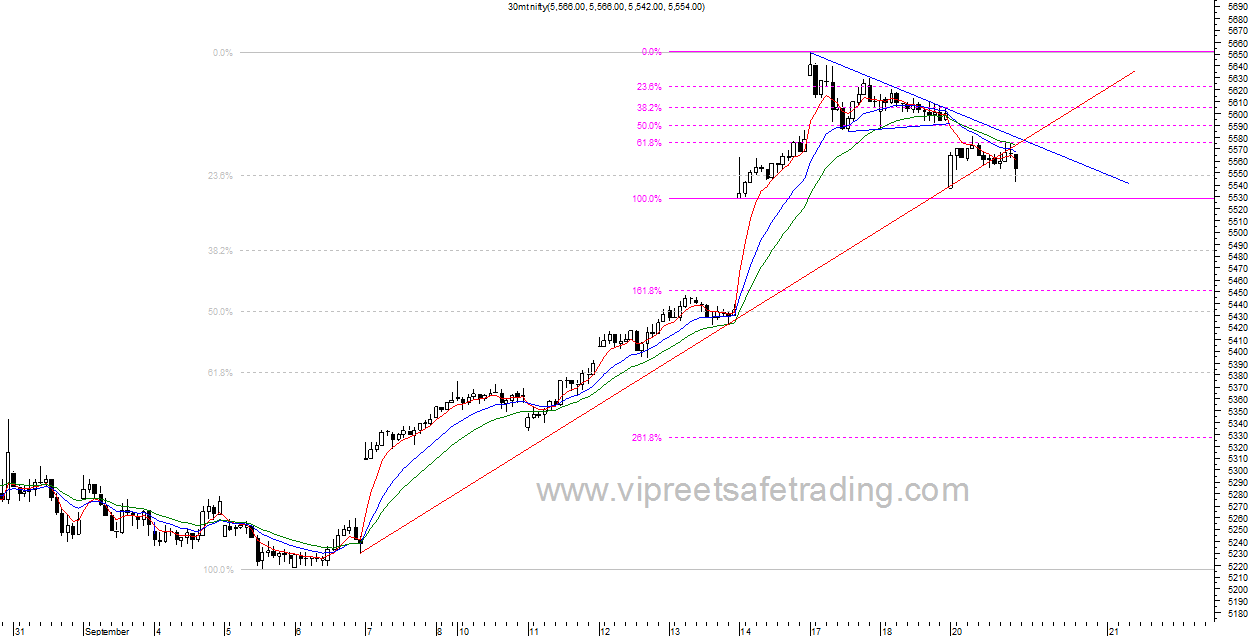
To go back to the Markets :
The Markets have made a 52 week high on renewed energy from the news of reforms. Is this a time to buy or sell?

We had come up with 2 products, Cherry Picks and Midcap magic, both which have done exceedingly well. We have made a study of the same which we have put up in the September update.Since the picks are still valid investments we will not be able to show it publicly. However here is a small summary of the performance :
Investment Cherry Picks was initiated on 1st September 2011 and the return has been 47 pc. Midcaps were launched on 1st Jan 2012 and the return has been 52 %.
Couple of picks, 1 from each portfolio as below:

Stock
Recc Price
High since recco
Low since recco
Max Gain
Gain since Recco
Avg Gain
IDFC
110
161
90
78.89
46.36
62.63
Voltas
73
136
72
88.89
86.3
87.6


We are coming up with a new product called the "Top Ten Picks for All Seasons" which we will unveil shortly. We expect the markets to dip a bit now, then peak around Diwali and the year end. Post that, we expect the markets to have a bad 2013 before rallying up again. As per the 8 year cycle, the markets should peak sometime in 2015-2016.

The trick in earning off the markets lies in identifying good stocks which have seen several bull and bear cycles. Keep holding them, enjoying the dividends and keep lowering the cost of acquisition which we explain "how to" to subscribers.We would also be issuing an alert, when we feel the market is close to getting overheated so that our subscribers get sufficient time  to book the 50%.
For our loyal existing subscribers, we would have an extremely discounted price which we have intimated already. For those new subscribers who pre-order within the next 10 days we have a discounted price too. .

So hurry and come shopping with me.Write to me at vipreetsubscription@gmail.com


follow me on twitter http://twitter.com/#!/lucksr

Happy Trading !!
Lakshmi Ramachandran
www.vipreetsafetrading.com

Saturday, September 29, 2012

S&P500 28th September 2012


Daily Chart 


 Daily Chart 


 Good bounce from the 1429 support forming a  descending triangle as shown on the second chart.This is a bearish  pattern and only a break above it's resistance line will nullify it's bearishness.Break of support line will see the downtrend resuming.

Resistance at 1452-1458-1460 Support at 1438-1430-1413


follow me on twitter http://twitter.com/#!/lucksr

Happy Trading !!
Lakshmi Ramachandran
www.vipreetsafetrading.com

Reigning The Nifty 28th September 2012


Daily Chart


Consolidation between 5638-5710 continued within the flag with the Nifty testing the low made yesterday at 5638.The low has held and raises hopes of an upward breakout level  which is at 5689.The levels to watch therefore are 5638-5689 for tomorrow.Only a breakout will give short term direction.Else the lacklustre movement will continue.


Half Hourly Chart


Half hourly charts look mildly weak with the uptrendline being broken retested and the fall resumed.The 63 ema which was good support has been broken and Nifty closed below it.The fact that bulls did not take advantage of the flag breakout and were overwhelmed by the bears indicates it may be advantage bears now.
Fibonacci supports marked


follow me on twitter http://twitter.com/#!/lucksr

Happy Trading !!
Lakshmi Ramachandran
www.vipreetsafetrading.com

Reigning The Bank Nifty 28th September 2012


Daily Chart


Consolidation continued within the flag.Levels to watch are  11480-11321. OBV has made a minor high and low indicating Bank Nifty may be in for a short term downtrend. Oscillators are in overbought one but not showing any weakness.

The half hourly chart is showing consolidation in a flag formation which should ideally break out from the resistance line and continue the uptrend.The 63 ema is intact and coincides with the low made at 11321.Break of this support may bring in some more weakness.


Half Hourly Chart


follow me on twitter http://twitter.com/#!/lucksr

Happy Trading !!
Lakshmi Ramachandran
www.vipreetsafetrading.com

Thursday, September 27, 2012

S&P500 27th September 2012


Daily Chart 


 Crucial for the S&P500 to hold the neckline at 1428.50 to keep the bears at bay.Break of the neckline will see a fall to 1397-1380.


follow me on twitter http://twitter.com/#!/lucksr

Happy Trading !!
Lakshmi Ramachandran
www.vipreetsafetrading.com

Reigning The Nifty 27th September 2012


Daily Chart  


 A lower high lower low candle fromation continued within a narrow range.The consolidation continues.Oscillators are moving lower in the overbought region but not showing weakness.Support at 5637 which coincides with today's lows of 5639.A move below this may test 5610.


follow me on twitter http://twitter.com/#!/lucksr

Happy Trading !!
Lakshmi Ramachandran
www.vipreetsafetrading.com

Reigning The Bank Nifty 27th September 2012


Daily Chart


The 11451 proved resistance once again and the Bank Nifty made a lower high but higher low doji candle.Consolidation seems to be taking place forming a flag pattern.


follow me on twitter http://twitter.com/#!/lucksr

Happy Trading !!
Lakshmi Ramachandran
www.vipreetsafetrading.com

Wednesday, September 26, 2012

S&P500 26th September 2012


Daily Chart 


 The breakout from the rising wedge was confirmed and made decisive with a huge bearish candle which resisted at the support line of the rising wedge.Having broken and closed below the 38.2% retracement level The S&P should test  the 50% level at 1435. Holding the neckline at 1428.50 is important for the uptrend.61.8% level is at 1426 so this level should provide good support.


follow me on twitter http://twitter.com/#!/lucksr

Happy Trading !!
Lakshmi Ramachandran
www.vipreetsafetrading.com

Reigning The Nifty 26th September 2012


 Daily Chart 


A gradual lower high lower low candles being formed since Monday.Today's candle was a doji confusing the bears as well as the bulls about Nifty's direction.The uptrendline support at 5604 is crucial to be held as it coincides with the 61.8% fibonacci level of rise from 5528 - the gap up candle low made on 14th September 2012.


follow me on twitter http://twitter.com/#!/lucksr

Happy Trading !!
Lakshmi Ramachandran
www.vipreetsafetrading.com

Reigning The Bank Nifty 26th September 2012


Daily Chart


The 11451 resistance held and the Bank Nifty made a lower high lower low doji candle.This may be signalling a pullback.Oscillators too need some cooling off as they are in the overbought region.The fall will be only a correction as the Bank Nifty is in a strong uptrend.


follow me on twitter http://twitter.com/#!/lucksr

Happy Trading !!
Lakshmi Ramachandran
www.vipreetsafetrading.com

Tuesday, September 25, 2012

S&P500 25th September 2012


Daily Chart 


 Break and close below the rising wedge gives a target of 1380.It is normal for price to retest the neckline and then continue it's journey up.The green neckline is at 1428.Let's hope it holds and the S&P500 restarts it's journey to higher targets.


follow me on twitter http://twitter.com/#!/lucksr

Happy Trading !!
Lakshmi Ramachandran
www.vipreetsafetrading.com

Reigning The Nifty 25th September 2012


Daily Chart  


The resistance at the red trendline continued today with the Nifty failing to touch the high made on Friday leading to an "Inside Day".This indicates indecision and may lead to some pullback.The break of the high or low of friday , 5720-5575, should provide short term direction.


follow me on twitter http://twitter.com/#!/lucksr

Happy Trading !!
Lakshmi Ramachandran
www.vipreetsafetrading.com

Reigning The Bank Nifty 25th September 2012


Daily Chart


The Bank Nifty made a new 52 week high crossing the July 2011 peak of 11451 but could not close above it.OBV has crossed it's all time high indicating the Bank Nifty may do so too.Oscillators are in overbough territory but showing no weakness.
Buy on all dips.


follow me on twitter http://twitter.com/#!/lucksr

Happy Trading !!
Lakshmi Ramachandran
www.vipreetsafetrading.com

Monday, September 24, 2012

S&P500 24th September 2012


Weekly Chart 


An "Inside Day" was formed on weekly charts indicating hesitation,indecision.The high and low,1475-1429, of the previous candle will be levels to be watched for further direction.

 Daily Chart 


Redrawn trendlines to form a rising wedge which ha sbearish implications.1450 is important support.


follow me on twitter http://twitter.com/#!/lucksr

Happy Trading !!
Lakshmi Ramachandran
www.vipreetsafetrading.com

Reigning The Nifty 24th September 2012


Weekly Chart


Daily Chart


Technicals did give indications of things to come -read the political events- with the Triangle breakout which continued on huge volumes. Nifty has reached a resistance area as shown on daily charts and needs to cross the 5740 and breakout of the red channel.Support exists at 5562 on the uptrendline from 5215.
Once this resistance is taken out the 5944 area will be easy to reach.This area though should attract good pullback as it is a strong resistance area.Weekly oscillators too show room for more upsides.Buy on dips.


follow me on twitter http://twitter.com/#!/lucksr

Happy Trading !!
Lakshmi Ramachandran
www.vipreetsafetrading.com

Reigning The Bank Nifty 24th September 2012


Weekly Chart


Daily Chart


The Bank Nifty crossed it's 52 week high and closed above it on high volumes after breaking out of the pennant shown yesterday on half hourly charts.OBV has crossed it's all time highs indicating Bank Nifty could do so too.
Weekly stochastics and Macd have failed to reach their respective highs made in February 2012.Rsi14 has crossed it showing strength in the move.Daily and half hourly oscillators are showing negative divergence too.
 Immediate resistances are from previous peaks at 11451 and 11978.The 76.4% retracement level of fall from all time highs to December 2011 lows is at 11997 making it tough resistance.
The divergences and resistance may bring in some pullback which should be used to enter the Bank Nifty.


follow me on twitter http://twitter.com/#!/lucksr

Happy Trading !!
Lakshmi Ramachandran
www.vipreetsafetrading.com

Friday, September 21, 2012

S&P500 21st September 2012


Daily Chart 


A hanging man breaking below the uptrending channel. This is a bearish candle. A decisive breakout below it's low will increase the downward momentum. A breakout from the pennant will lead to a continuation of the uptrend.


follow me on twitter http://twitter.com/#!/lucksr

Happy Trading !!
Lakshmi Ramachandran
www.vipreetsafetrading.com

Reigning The Nifty 21st September 2012


Daily Chart


 Half Hourly Chart


A gap down open which Nifty managed to  close  only partially during the day.The uptrendline from 5215 shown on half hourly charts was broken  .On daily charts the uptrendline has been maintained and has support at 5527 which is also the gap support at 5435-5527 making it an important support to be held.

Rsi15 and stochastics have moved below the 70 and 80 level respectively which is their overbought levels clearly signalling more downsides.OBV too has turned down.Macd though is positive indicating this may be only a correction.

The Nifty has been making a higher high higher low formation on daily charts and till 5215 is held the trend would be up with a Buy on Dips startegy.


follow me on twitter http://twitter.com/#!/lucksr

Happy Trading !!
Lakshmi Ramachandran
www.vipreetsafetrading.com

Reigning The Bank Nifty 21st September 2012


Daily Chart 


  Half Hourly Chart 


 Daily charts show a shooting star which is a bearish candle pattern indicating a possible reversal.Oscillators have turned down from the overbought region which increases possibilities of a correction.

 However bad news from the political front was not given much importance and the Bank Nifty continued to consolidate within a flag the gains  made with runaway gaps of 1250 points from 9814 to 11065., as shown on half hourly charts.

Till the gap support at 10642-10797 is held chances of the upmove resuming are high.Watch out for a breakout or breakdown from the flag for immediate direction.


follow me on twitter http://twitter.com/#!/lucksr

Happy Trading !!
Lakshmi Ramachandran
www.vipreetsafetrading.com

Thursday, September 20, 2012

S&P500 20th September 2012


Daily Chart 


 A higher high higher low candle was made maintaining within the uptrendling channel..The range though was tiny as has been since the beginning of this week.A flag pattern is seen again and the breakout point is 1464 for today.Watchout if it breaks out to continue the uptrend or breaks down from 1452 support to give a correction.


follow me on twitter http://twitter.com/#!/lucksr

Happy Trading !!
Lakshmi Ramachandran
www.vipreetsafetrading.com

Reigning The Nifty 20th September 2012


Daily Chart  


  Half Hourly Chart 


 An "Inside Day" pattern was formed where the day's candle remained within yesterday's candle range.The low was just a point away which formed a descending triangle as seen on the half hourly chart.If the low of 5585 is broken Nifty could test 5518. This will fall into the gap area and may lead to filling the 5435-5528 gap. Uptrendline from 5215 on half hourly charts offers support at 5540 to 5573 for the day.

 The Nifty is in an uptrending channel and may test the support line. Scaling 5652-5665 will clear the resistance for 5941 which is the 76.4% fibonacci level.


follow me on twitter http://twitter.com/#!/lucksr


Happy Trading !!
Lakshmi Ramachandran
www.vipreetsafetrading.com

Reigning The Bank Nifty 20th September 2012


Daily Chart  


Half Hourly Chart 


Bank Nifty made a higher high and closed towards the day's high.The half hourly charts show a rising wedge forming with oscillators showing negative divergence  could lead to some pullback if the support line breaks.10895 which is support at the red neckline on daily charts should hold for keeping the bullishness alive in the short term.


follow me on twitter http://twitter.com/#!/lucksr

Happy Trading !!
Lakshmi Ramachandran
www.vipreetsafetrading.com

Wednesday, September 19, 2012

S&P500 19th September 2012


Daily Chart 


Lower high lower low made within a tiny range.The blue uptrending channel is maintained and logically the next leg up should start with resistance at 1487.


follow me on twitter http://twitter.com/#!/lucksr

Happy Trading !!
Lakshmi Ramachandran
www.vipreetsafetrading.com

Tuesday, September 18, 2012

S&P 500 18th September 2012


Daily Chart 


 Resistance zone upto all time highs at 1576 will be difficult to trade.The trend is up and one can continue longs with tight stop losses for higher targets mentioned in my earlier posts.Immediate support and resistance marked on the blue channel.


follow me on twitter http://twitter.com/#!/lucksr

Happy Trading !!
Lakshmi Ramachandran
www.vipreetsafetrading.com

Reigning The Nifty 18th September 2012


Daily Chart  


Gap open today but formed a near doji as the Nifty found it difficult to sustain at the highs.Strong resistance exists at the 61.8% level from which the Nifty had reversed in February and made a top at 5630. After making a slightly higher top at 5652, the Nifty was in correction all day.

Efforts to recover met resistance at the 61.8% level of the intraday fall.The gap was almost closed.Failure to cross the high of 5652 and a break of today's low at 5585 may lead to some unwinding.If gap at 5435-5427 which also has trendline support as shown below, is closed, 5452 may prove to be a short  term top.


 Daily Chart


follow me on twitter http://twitter.com/#!/lucksr

Happy Trading !!
Lakshmi Ramachandran
www.vipreetsafetrading.com