
Weekly Chart

Daily Chart

Half Hourly Chart
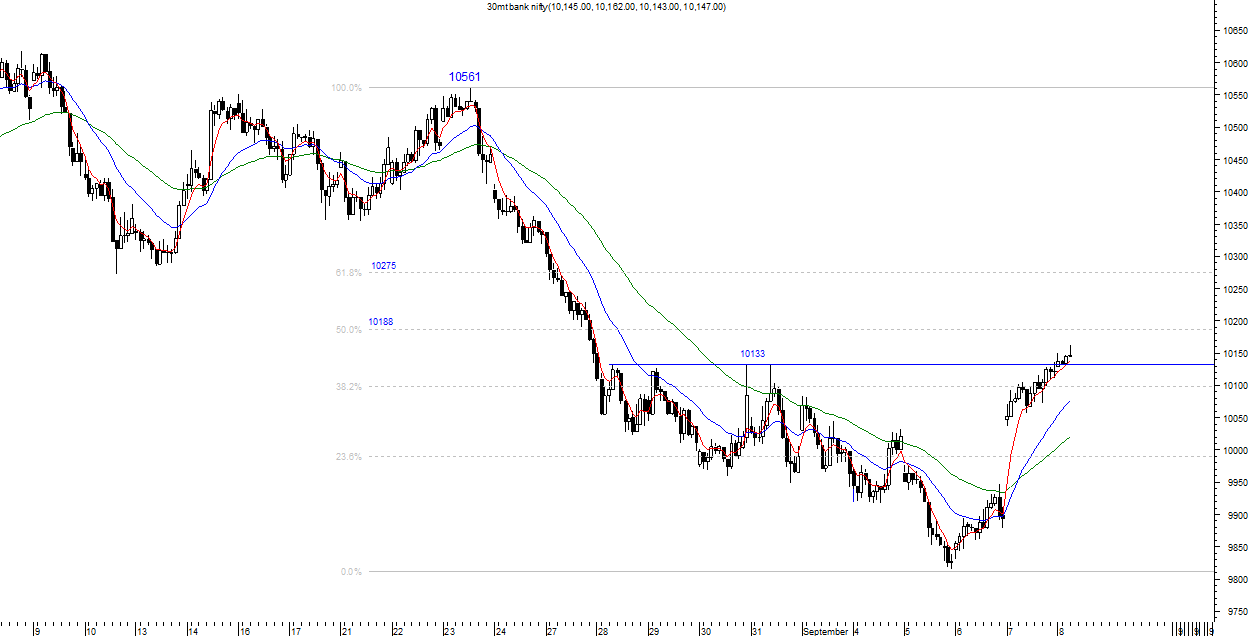
Last week I had warned of more selling and that 10133 would be strong resistance.Selling did come with the Bank Nifty taking support around the fibonacci cluster at 9900 and the uptrendline from December lows.
Friday's Inside day pattern turned out to be a reversal pattern with the Bank Nifty gapping up and closing above it.Close above the red channel shown on weekly charts gives a logical target of 10455 on the resistance line of the channel.
Friday's Inside day pattern turned out to be a reversal pattern with the Bank Nifty gapping up and closing above it.Close above the red channel shown on weekly charts gives a logical target of 10455 on the resistance line of the channel.
Daily oscillators have reached the oversold zone and turned up indicating start of an upmove.Weekly oscillators on the other hand have not reached the oversold zone indicating room for more selling. A higher top higher bottom sequence needs to be formed to declare the trend bullish.
Till the gap made between 9893 and 10036 is unfilled bullish attempts will be made.
Till the gap made between 9893 and 10036 is unfilled bullish attempts will be made.
follow me on twitter http://twitter.com/#!/lucksr
Happy Trading !!
Lakshmi Ramachandran
www.vipreetsafetrading.com

No comments:
Post a Comment