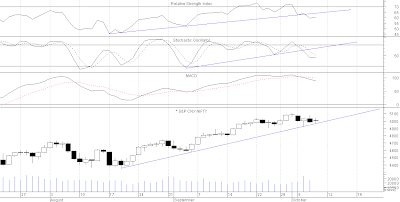
Daily Chart
Daily Oscillator Chart
Coiling on Half Hourly Chart
- Inside day and a doji indicating extreme indecision.
- Lower top , lower bottom candle indicating .bulls not very active.
- Daily oscillators have broken below their respective trendlines from August lows which is a bearish indication.
- Daily Macd in sell since Tuesday, 6th October.
- Head and shoulders pattern forming with neckline at 4929. This now coincides with the uptrendline from March 2009 lows, making it a very improtant support.
A range has been established between 5110 and 4920. Till one of the boundries is not taken out trading will be difficult . The triangular coiling clearly visible on intraday charts is leading to a lot of whipsaws.
Weekly supports are at 4980 and below that at 4830.
The markets are undecided as yet and so the startegy of remaining neutral continues.
Happy Trading !!
Lakshmi Ramachandran
www.vipreetsafetrading.com


No comments:
Post a Comment