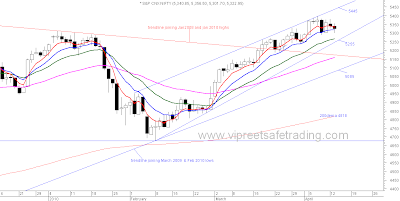
Daily Chart
Daily Chart II
Half Hourly Chart
- The Inside day range remained unbroken, leaving traders confused about the direction of the immediate trend.
- Daily oscillators including the OBV have broken below the respective lows made when Nifty made the low at 5049 indicating the Nifty may correct further.
- Half Hourly oscillators are in neutral zone.
- The fall since Nifty touched 5400 has been at a very slow rate on very low volumes which favours an upmove after the consolidation.
- Nifty is on the lower end of the green triangle shown on half hourly charts.Thus if Nifty remains above 5300 we may have a test of 5360-5370.
Lakshmi Ramachandran
www.vipreetsafetrading.com


2 comments:
maam,
what is the 5085 line in daily chart-2 ? I understand the two range lines above ( even there how did you mark 5445 ? ).
Thanks
gd
both are trendline resistance and support for the day
Post a Comment