Om Sri Ganeshaya Namaha

Om  Sri  Ganeshaya  Namaha
follow me on twitter http://twitter.com/#!/lucksr

Monday, September 10, 2012

Reigning The Nifty 11th September 2012


Daily Chart


Half Hourly Chart


Nifty failed to hold above the 61.8% retracement level forming a doji pattern on daily charts.The doji after a move signals waning of momentum and a hesitation to carry on the uptrend.

Half hourly charts however show the Nifty corrected in a sideways movement forming a flag.The flag is a bullish continuation pattern and expected to break on the upside.A break and close above today's high of 5375 is required to avoid going down.Supports and resistance marked on charts.


follow me on twitter http://twitter.com/#!/lucksr

Happy Trading !!
Lakshmi Ramachandran
www.vipreetsafetrading.com

S&P500 10th September 2012


 Weekly Chart 


Daily Chart 


 An inverted head and shoulder bullish pattern spotted on daily charts.Neckline has been successfully broken giving a target of  1580.

Strong resistance at 1347.Some reaction should be expected at this level.Neckline support at 1427.


follow me on twitter http://twitter.com/#!/lucksr


Happy Trading !!
Lakshmi Ramachandran
www.vipreetsafetrading.com

Reigning The Nifty 10th September 2012


Weekly Chart


Daily Chart


Half Hourly Chart


Last week I had said a trade above 5300 would be bullish and below 5200 would be bearish. I had also declared the short term bearish with the 5/20 ema bearishly crossed.
The Nifty remained range bound between the 5200-5300 levels all week but broke out of the 5300 mark on Friday. The 5/20 ema too crossed over bullishly thus signalling  start of the uptrend again.

Breakout from the symmetrical triangle on the weekly charts has been maintained after retesting the resistance line.A break and close above 5449 will bring in the bullishness once again for a test of the all time highs at 6338. A rising wedge forming shown on Daily charts which may cap upsides  at 5500 for the week.

Resistance now at 5399-5449.Gap at 5393-5415 will also act as resistance. Nifty has retraced the 61.8% fibo level of the fall from 5449 and may pullback in the very short term.Gap made on Friday at 5238-5309 will act as strong support.


follow me on twitter http://twitter.com/#!/lucksr

Happy Trading !!
Lakshmi Ramachandran
www.vipreetsafetrading.com

Reigning The Bank Nifty 7th September 2012


Weekly Chart


 Daily Chart


 Half Hourly Chart


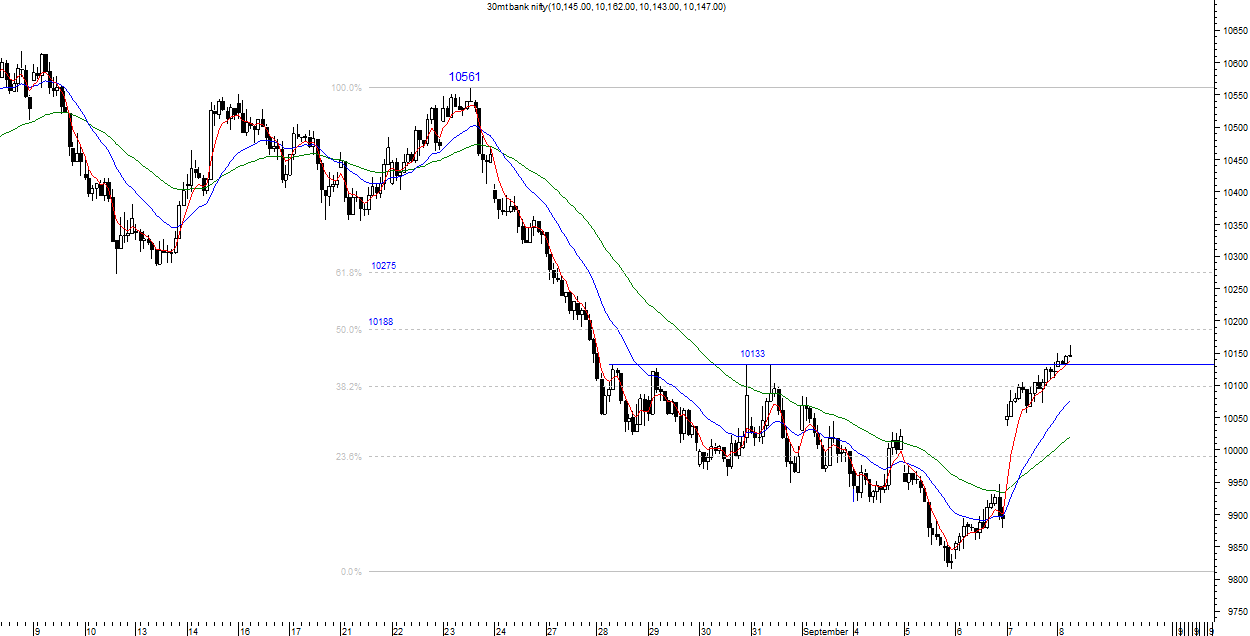
Last week I had warned of more selling and that 10133 would be strong resistance.Selling did come with the Bank Nifty  taking support  around the fibonacci cluster at 9900  and the uptrendline from December  lows.

Friday's Inside day pattern turned out to be a reversal pattern with the Bank Nifty gapping up and closing above it.Close above the red channel shown on weekly charts gives a logical target of 10455 on  the resistance line of the channel.

Daily oscillators have reached the oversold zone and turned up indicating start of an upmove.Weekly oscillators on the other hand have not reached the oversold zone indicating room for more selling. A  higher top higher bottom sequence needs to be formed to declare the trend bullish.

Till the gap made between 9893 and 10036 is unfilled bullish attempts will be made.


follow me on twitter http://twitter.com/#!/lucksr

Happy Trading !!
Lakshmi Ramachandran
www.vipreetsafetrading.com

Friday, September 7, 2012

S&P500 7th September 2012


Daily Chart 


 The Pennant broke out on the upside as expected with a very bullish candle.The target for this breakout is 1479 but the rising wedge threatens to resist  at  1447.


follow me on twitter http://twitter.com/#!/lucksr

Happy Trading !!

Lakshmi Ramachandran
www.vipreetsafetrading.com