Om Sri Ganeshaya Namaha

Om  Sri  Ganeshaya  Namaha
follow me on twitter http://twitter.com/#!/lucksr

Tuesday, May 31, 2011

Reigning The Nifty Monthly Update


Monthly Chart


 Monthly Chart II


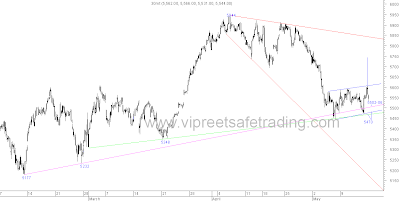
The monthly charts made a lower high lower low candle. The long lower shadow shows good recovery efforts. the lower trendline of the blue channel held well . Chart II however shows the 12 month ema which has been a good indicator of the trend has been broken once again.Whipsaws around this ema, as happened in the 2008 correction,  check out chart II, indicates weakness to come.

Scaling 5833-5944 should bring in some strength else expect the downmove to continue.

follow me on twitter http://twitter.com/#!/lucksr

Happy Trading !!
Lakshmi Ramachandran
www.vipreetsafetrading.com

Reigning the Bank Nifty Monthly Update


Monthly  Chart


The Monthly charts show weakness with a lower high and lower low candle. The recovery efforts made after the huge fall this month has formed a bullish lower shadow on the month's candle.The stochastics had given a buy last month after reaching oversold zone and is continuing to show strength.We may expect more upside as per the stochastics. But the macd is in sell and Rsi 14 too is moving down.

The range between 11978-10017  has been formed which needs to be broken for further direction.

Resistance and Supports marked on charts.


follow me on twitter http://twitter.com/#!/lucksr

Happy Trading !!
Lakshmi Ramachandran
www.vipreetsafetrading.com

Midday Nifty


Half Hourly Chart


As anticipated in my weekly analysis ( read here  http://vipreetinvestments.blogspot.com/2011/05/reigning-nifty-weekly-update-28th-may.html ) , the bulls have won for the time being and succeeded in moving above the red neckline of the inverted head and shoulder pattern. The target should be around 5700 which also coincides with the 61.8% fibo level of fall from 5944 to 5330. The portions shown in red elipse also show support/resistance around 5700. This should therefore be  strong resistance. 


follow me on twitter http://twitter.com/#!/lucksr

Happy Trading !!
Lakshmi Ramachandran
www.vipreetsafetrading.com

Reigning The Nifty -31st May 2011


 Daily Chart


 Half Hourly Chart


Lacklustre trading within a 50 point range closing at the same level as the last trading session.This would be inferred as a wane in the up ward momentum as a rally was on from lows of 5328. As mentioned in my Midday update, the green neckline, shown on half hourly charts, proved good resistance.

Daily charts show a probable right shoulder of a bearish head and shoulder pattern forming , whereas the half hourly charts show a probable  right shoulder of a bullish head and shoulder forming. If the bullish one breaks out from the 5505-5516 resistance then the right shoulder of the bearish one could top out around 5700. If the 5505-5516 is not overcome then the head and shoulder pattern with the green neckline , which is already broken, will continue to move down to it's target of 4910.
Refer post of 18th May http://vipreetinvestments.blogspot.com/2011/05/reigning-nifty-18th-may-2011.html


follow me on twitter http://twitter.com/#!/lucksr

Happy Trading !!
Lakshmi Ramachandran
www.vipreetsafetrading.com

Reigning the Bank Nifty 31st May, 2011


 Daily Chart


The Bank Nifty climbed above the neckline and closed above it.Now the bear flag support line will prove resistance to the on going upmove. If overcomes it then bullish momentum should increase.Macd on daily charts has given a buy in the oversold region.Stochastics and Rsi 14 are moving up after giving positive divergence.Volumes though is not very impressive.

Till the low of 10340 is held a pullback to 10780-10882-11213 is possible.


follow me on twitter http://twitter.com/#!/lucksr

Happy Trading !!
Lakshmi Ramachandran
www.vipreetsafetrading.com

Monday, May 30, 2011

S&P 500 update 31st May 2011


Weekly Chart


Daily Chart


The fall since the high of 1370 has been very gradual. Momentum on the downside seems to be missing. This is obvious by the dojis made in the last three weeks. The rise from 1294 to 1371  took just 9 days has not been  retraced completely even after 20days. Last week's  candle resembles a hammer which will have bullish implications with confirmation from next week's candle.Weekly stochastic seems to support the downmove  whereas the daily stochastic which is now in the oversold region signals the rally from 1312 may continue. The close too was once again above the 50 dema.

Key level to cross for the upmove is 1335. Support  is at  1310-1305.


follow me on twitter http://twitter.com/#!/lucksr

Happy Trading !!
Lakshmi Ramachandran
www.vipreetsafetrading.com

Midday Nifty


Half Hourly Chart


The green neckline is acting as resistance. The fall though does not have much strength. This could be a minor reaction forming the right shoulder on the bullish head and shoulder pattern with neckline shown in red. Clearing 5516 will set the stge for some upward momentum.


follow me on twitter http://twitter.com/#!/lucksr

Happy Trading !!
Lakshmi Ramachandran
www.vipreetsafetrading.com

Ominous looking candle on Nifty hourly chart


Hourly Chart


follow me on twitter http://twitter.com/#!/lucksr

Happy Trading !!
Lakshmi Ramachandran
www.vipreetsafetrading.com

Reigning The Nifty -30th May 2011


 Daily Chart


Daily Chart II


The weekly candle formed a bullish hammer at good support. The daily charts show support taken once again at the 5348 levels which has been broken twice, but only briefly. Positive divergences on oscillators, shown in Chart II, encourage the bullish view. Breakout from the short term trendline joining tops from 5605 top on 13th May  promises some pullback.Volumes on the last two days were encouraging.

However this could be the right shoulder of a bearish head and shoulder pattern forming. The 50 and 200 dema too are bearishly aligned for the second time since the fall from 6338. So one needs to be cautious till more evidence of bullishness emerges.


Half Hourly Chart


Half Hourly Chart II


Half hourly charts show clearly that the right shoulder of  the head and shoulder bearish pattern may be forming.Chances of targetting 5700 are good , a level which should prove strong resistance.

Mild bullishness is creeping in but it is difficult and too early to pinpoint whether it is a reversal or just a pullback. Being cautiously optimistic till the neckline breaks will be a prudent strategy.


follow me on twitter http://twitter.com/#!/lucksr

Happy Trading !!
Lakshmi Ramachandran
www.vipreetsafetrading.com

Reigning the Bank Nifty 30th May, 2011


 Daily Chart


Daily Chart II


Chart I shows a classic test of the neckline which should lead to a resumption of the downtrend after such retest.But the breakout from the short term downtrendline drawn from the the recent peak of 11978 and  support taken at the 161.8%  of rise from 10677 to 11213, shown in red on chart II, positive divergences on the stochastics and Rsi 14,  all point to a possible pullback.

Till the low of 10340 is held a pullback to   10780-10882-11213 is possible.


follow me on twitter http://twitter.com/#!/lucksr

Happy Trading !!
Lakshmi Ramachandran
www.vipreetsafetrading.com

Sunday, May 29, 2011

Reigning the Bank Nifty Weekly Update - 28th May, 2011


 Weekly Chart


Weekly Chart II


The Bank Nifty is in tandem with the Nifty having made a hammer  on the weekly charts. Some pullback may be expected due to it's bullish psychological characteristic.The fact that the bulls managed to finally pull up prices and close at the upper range, weakens the bear strength to continue pushing prices down.

Bear flags are formed by the early short sellers  booking profits and investors who consider the fallen prices as a bargain.Eventually the bears win as the genuine buying with good volumes is absent.

In case of the Bank Nifty, the bear flag has now been decisively broken on the downside. This will  weigh on the  mind of the bulls and cap the  rises.The bullish hammer though may see some pullback.

View : Mildly bullish with possible caps at  10972-11156-11360. Stop loss on longs at low of hammer - 10340.

follow me on twitter http://twitter.com/#!/lucksr

Happy Trading !!
Lakshmi Ramachandran
www.vipreetsafetrading.com

Saturday, May 28, 2011

Reigning The Nifty Weekly Update 28th May 2011


Weekly Chart


 Weekly Chart II


  • A bullish hammer on weekly charts conforming to the physical features perfectly -- Small real body at the upper trading range, long lower shadow at least twice the length of the body, little or no upper shadow, occured in a downtrend.
  • The hammer occuring  at good support -- on the red trendline on chart II  - 5330 held  ( refer my weekly post of 14th May http://vipreetinvestments.blogspot.com/2011/05/reigning-nifty-weekly-update-14th-may.html  ), makes the bullishness more convincing.
  • 100 wema support respected once again , earlier supported when Nifty fell to 5177.
  • Follow up buying, forming a white candle for the coming week, required to confirm the bullishness.
  • The 5300 level is strong support and a crucial level to be held as shown on the charts.Only a break below this level will bring in panic.
Weekly charts are weak with the break below the uptrendline from March 2009 lows having been broken decisively. This is the second consecutive week of trade below the trendline. However, the bullish hammer occuring at good support, the holding of the 100 wema and the 5300 level , raises hopes of some recovery efforts.

One could be cautiously optimistic with a stop of  5300. Hurdles at  5582-5640-5710.


follow me on twitter http://twitter.com/#!/lucksr

Happy Trading !!
Lakshmi Ramachandran
www.vipreetsafetrading.com

Friday, May 27, 2011

S&P 500 update 27th May 2011


 Daily Chart


Since I last saw the chart on the 17th of May, the fall has been harder than the weak rise to 1347.The trend is clearly down.Clearing 1336 may see some recovery else expect the fall to resume.


follow me on twitter http://twitter.com/#!/lucksr

Happy Trading !!
Lakshmi Ramachandran
www.vipreetsafetrading.com

Midday Nifty


 Half Hourly Chart


 Targets for this upmove which may be the right shoulder are 5516-5605-5632-5720


follow me on twitter http://twitter.com/#!/lucksr

Happy Trading !!
Lakshmi Ramachandran
www.vipreetsafetrading.com

Reigning The Nifty -27th May 2011


 Half Hourly Chart


 Forming the Right Shouder? This is all I can post now as I am still to come back mentally from my dream vacation to Leh.


follow me on twitter http://twitter.com/#!/lucksr

Happy Trading !!
Lakshmi Ramachandran
www.vipreetsafetrading.com

Thursday, May 19, 2011

Reigning The Nifty - 19th May 2011


 Daily Chart


Nifty closed below the head and shoulder neckline for the second day in a row .Targets for the fall are 4910 as per the head and shoulder pattern. The bear flag gives a target of 5010. Improtant supports are marked on the charts.Oscillators are showing positive divergence as they have failed to make a lower low alongwith the Nifty. A pullback may be coming which would best be sold into.


Half Hourly Chart


Oscillators continue to be in positive divergence.Bears may take a pause.

On vacation from tomorrow. Will be back on the 27th !!


follow me on twitter http://twitter.com/#!/lucksr

Happy Trading !!
Lakshmi Ramachandran
www.vipreetsafetrading.com

Reigning the Bank Nifty 19th May, 2011


 Daily Chart


Follow up selling was there but  somewhat subdued.  The neckline of the head and shoulder pattern, shown in green,  proved  resistance  today and the close was below it. Target of the pennant is 9587 and the head and shoulder target is 9375.

The trend is down  and till the lower high lower low candles turn into higher high higher low candles selling will continue.

On vaccation from tomorrow . Will be back on 27th !


follow me on twitter http://twitter.com/#!/lucksr

Happy Trading !!
Lakshmi Ramachandran
www.vipreetsafetrading.com

Wednesday, May 18, 2011

S&P 500 update 18th May 2011


Daily Chart


So the dow sell signal has been given with a close below 1329. The hammer like pattern formed by yesterday's candle could see some pull back. This is supported by a close above the 50 dema and the green support line of the decending triangle.

Resistance is at 1336 and support at 1318.

follow me on twitter http://twitter.com/#!/lucksr

Happy Trading !!
Lakshmi Ramachandran
www.vipreetsafetrading.com

Midday Nifty


Half Hourly Chart


Tick Chart

 Tick charts show weakness and the half hourly charts show the possible pauses that the Nifty may take.

follow me on twitter http://twitter.com/#!/lucksr

Happy Trading !!
Lakshmi Ramachandran
www.vipreetsafetrading.com

Reigning The Nifty - 18th May 2011


Daily Chart


" However, today's Inside day shows the bulls have already exhausted themselves and the upside momentum has waned " . Well the exhausted bulls got a good bear hug today and fell below the neckline of the head and shoulder pattern. The technicals were saying it all and thats what is so good about technicals.

Targets for the fall should now be 4910 as per the head and shoulder pattern. The bear flag gives a target of 5010. Improtant supports are marked on the charts.


Half Hourly Chart

Half hourly charts showing positive divergence. Strong supports at 5348-5335 may give rise to a bounce before resuming the fall.

follow me on twitter http://twitter.com/#!/lucksr

Happy Trading !!
Lakshmi Ramachandran
www.vipreetsafetrading.com

Reigning The Bank Nifty 18th May 2011


 Daily Chart


Daily Chart II


I said " However, today's Inside day shows the bulls have already exhausted themselves and the upside momentum has waned ". 
Waned it had and the Bank Nifty broke the earlier low of 10677 to close at 10669 making a huge bearish candle for the day.Having broken out of the pennant which I have been pointing out in my earlier posts, the fall should target 9587.
The neckline of the bearish head and shoulder has not been crossed decisively .Once that happens the momentum of the fall  should increase.


follow me on twitter http://twitter.com/#!/lucksr

Happy Trading !!
Lakshmi Ramachandran
www.vipreetsafetrading.com

Tuesday, May 17, 2011

S&P 500 update 17th May 2011


 Daily Chart


The Inside day pattern broke down and took support at the 50 dema and closed exactly at 1329  keeping market players on tenterhooks whether a lower low  is confirmed or not. Better to wait for a decisive break and close below the 1329 levels to confirm a lower low after a lower high at 1359

Holding 1327 will see a leg up to the down trendline from 1370. Supports and resistances marked on the chart.


follow me on twitter http://twitter.com/#!/lucksr

Happy Trading !!
Lakshmi Ramachandran
www.vipreetsafetrading.com

Midday Nifty


Half Hourly Chart


All cruclial trendlines broken and the road to lower targets of  sub 5000 levels commences. Break and close below 5443 will confirm this.


 Tick Chart


Tick charts show the weakness more clearly. Immediate targets should be 5443-5420


follow me on twitter http://twitter.com/#!/lucksr

Happy Trading !!
Lakshmi Ramachandran
www.vipreetsafetrading.com

Reigning The Nifty - 17th May 2011


Daily Chart


An Inside day pattern after an Outside day pattern. The outside day pattern  came after a very short term downtrend and encompassed three day's trading range,indicating short term sentiment could change. However, today's Inside day shows the bulls have already exhausted themselves and the upside momentum has waned.

The bear flag, a bearish pattern, which as discussed in earlier posts  continues to form in a classic textbook fashion.

The 5,10, 20 dema are all bearishly aligned with each other and the 50 and 200 dema which points to weakness.The fall from 5908 has been retraced only by around 25%

All daily oscillators exuding weakness.


Half Hourly Chart


The bear flag and a possible right shoulder continues to form.The pink uptrendline from 5177 lows is now resistance at around 5506-5508. Support on bear flag support line at  5482-5487 and green trendline at 5472-5475.

Break below these levels will find support at 5443-5348-5335, all levels shown in earlier posts. You may view it here  http://vipreetinvestments.blogspot.com/2011/05/reigning-nifty-12th-may-2011.html

follow me on twitter http://twitter.com/#!/lucksr

Happy Trading !!
Lakshmi Ramachandran
www.vipreetsafetrading.com

Reigning the Bank Nifty 17th May, 2011


 Daily Chart


Daily Chart II


An Inside day pattern after an Outside day pattern. The outside day pattern  came after a very short term downtrend and encompassed three day's trading range,indicating short term sentiment could change. However, today's Inside day shows the bulls have already exhausted themselves and the upside momentum has waned.

The pennant forming after a downtrend also indicates that the downtrend may resume after it breaks out from the pennant.

Trading below the 200 dema also shows weakness.All short term demas --5,10 and 20-- are bearishly aligned with each other and the 50 dema.

The fall from 11978 to 10677 took 9 days and the recovery from 10677 has already consumed 7 days  with just  40 % recovery. The technicals are therefore weakening once again indicating the fall may resume.Supports and resistances marked on the charts.


follow me on twitter http://twitter.com/#!/lucksr

Happy Trading !!
Lakshmi Ramachandran
www.vipreetsafetrading.com

Monday, May 16, 2011

S&P 500 update 16th May 2011


 Weekly Chart


Weekly charts show a bearish candle which is a near doji with a long upper shadow. The candle also formed an Inside day. Oscillators exude weakness after showing negative divergence.The trendline resistance at 1374 may prove difficult  to cross for the time being.


 Daily Chart


Daily charts too formed an Inside day which would be bullish for the S&P500 as per historical evidence. Read post of 18th March --   http://vipreetinvestments.blogspot.com/2011/03/s-500-update-18th-march-2011.html

The pennant broke on the down side as mentioned in my post of 12th May. Support comes at 1332. If held, then the Inside pattern magic may get the S&P500 to rally once again. Keep a strict stop of 1329 on longs.


follow me on twitter http://twitter.com/#!/lucksr

Happy Trading !!
Lakshmi Ramachandran
www.vipreetsafetrading.com

Midday Nifty


 Half Hourly Chart


 Nifty moving in a tight range. Immediate supports on pink,blue and green trendlines at 5505-5480-5470.Action is weak and should break down.

Tick Chart


Tick chart makes it more clear with a lower high lower low


follow me on twitter http://twitter.com/#!/lucksr

Happy Trading !!
Lakshmi Ramachandran
www.vipreetsafetrading.com

Reigning The Nifty - 16th May 2011


Daily Chart


 Daily Chart II


The Nifty reacted to political news and rallied on Friday but reacted after briefly crossing the earlier highs of 5593.The pattern formed is an outside pattern.This is within a bear flag and which could also be the right shoulder of the bearish head and shoulder pattern.The necklines are at 5474  and below that the larger head and shoulder neckline is at 5362.The only point which goes to the bulls here is the necklines are upward sloping. Downward sloping necklines are more bearish as the show lower lows.

Crossing the resistance line of the bear flag at 5610 will find resistance at 38.2% fibo level-5622,
200dema-5624 , and the 50 dema -5655.


Half Hourly Chart


Half hourly charts depict the same bear flag and bearish  head and shoulder patterns discussed on daily and weekly charts ( you may read the weekly post here http://vipreetinvestments.blogspot.com/2011/05/reigning-nifty-weekly-update-14th-may.html ).

The pullback action from lows of 5443 adhere to all bear flag requirements :
  • appearance after a downtrend
  • retracement of the downtrend during the formation of the bear flag is very "slight"
  • the pullback does not make new lows and is usually well channeled thus appearing like an upward moving channel or a parallel

The break in all possibility therefore, should be down with a move of  450 points from the point of break down.


follow me on twitter http://twitter.com/#!/lucksr

Happy Trading !!
Lakshmi Ramachandran
www.vipreetsafetrading.com

Reigning the Bank Nifty 16th May,2011


 Weekly Chart


The Weekly candle formed an Inside Day showing indecision.The upper and lower breakout points are 11543 and 10677. The red uptrendline from 2009 lows has been held once again on closing basis.Support on this trendline now comes at 10955.Crucial support at 9634 from where the next leg up  can start for  the flag pattern to take shape.The 38.2% retracement level of rise from 2009 low is around 9500.


 Daily Chart


Daily charts show the week's action mirrored the earlier week  but within a smaller range which is forming a pennant with resistance at 11170 and support at 10866.The right shoulder, of the head and shoulder bearish pattern with the green neckline, too may be forming. Crucial support on the neckline is at 10703.


follow me on twitter http://twitter.com/#!/lucksr

Happy Trading !!
Lakshmi Ramachandran
www.vipreetsafetrading.com