Om Sri Ganeshaya Namaha

Om  Sri  Ganeshaya  Namaha
follow me on twitter http://twitter.com/#!/lucksr

Monday, October 31, 2011

S&P500 31st October 2011


 Weekly Chart


Daily Chart


Technically the S&P 500 is in a sideways mode since the low of  1010 made in July 2010 is intact and the high of 1370 made in May 2011 has to be taken out to continue the uptrend once again.So broadly the Resistance is at 1370 and Support at 1010.

The short term uptrend from 1075 is intact and may find resistance at 1292-1300-1328.
Supports are at 1262-1242-1221.


follow me on twitter http://twitter.com/#!/lucksr

Happy Trading !!
Lakshmi Ramachandran
www.vipreetsafetrading.com

Reigning The Nifty 31st October 2011


 Weekly Chart


Broken out of the congestion of the last 3 months.The strong resistance of the downtrendline is at 5445.


Daily Chart


The huge gap up of 120 points needs to be held for the bullishness to contiue.The downtrendline which has been strong resistance for almost a year has resistance around the 5415 levels.If crossed the target of 5600 will be reached easily.


Half Hourly Chart


The half hourly chart shows an island reversal which is very bullish.


follow me on twitter http://twitter.com/#!/lucksr

Happy Trading !!
Lakshmi Ramachandran
www.vipreetsafetrading.com

Reigning The Bank Nifty 31st October 2011


 Weekly Chart


Daily Chart


Bullish hammer or hanging man?  The gap up was bullish but the fact that the earlier high of 9972 could not be crossed makes the bullishness suspect.The Bank Nifty has been under performing the Nifty which is also a pointer to the fact that the bank sector may continue to underperform.


Wait  for the high of 9972 and the 200 dema at 10380 to be crossed . Till then one can be cautiously optimistic.


follow me on twitter http://twitter.com/#!/lucksr

Happy Trading !!
Lakshmi Ramachandran
www.vipreetsafetrading.com

Sunday, October 30, 2011

Cherry Picks and The Gold Rush


Dear Readers,

Thanks for the overwhelming response to my picks.It was a pleasant surprise to me.Just a gentle reminder to the ones who are still attracted but undecided. The Gold Rush is free with the The Cherry Picks subscription till the end of this month, the Diwali month.

For those wondering what this is about please read my posts -

http://vipreetinvestments.blogspot.com/2011/10/calling-greedy.html
http://vipreetinvestments.blogspot.com/2011/10/gold-rush.html

Thanks once again,


follow me on twitter http://twitter.com/#!/lucksr

Happy Trading !!
Lakshmi Ramachandran
www.vipreetsafetrading.com

Friday, October 28, 2011

S&P500 28th October 2011


 Daily Chart


Negative divergence on the Stochastics


A rather smooth scaling of the strong resistance of 1258 on very good volumes.Negative divergence on the daily stochastics may lead to some pullback.

 Resistance at  1295-1307  Support at  1268-1258-1244


follow me on twitter http://twitter.com/#!/lucksr

Happy Trading !!
Lakshmi Ramachandran
www.vipreetsafetrading.com

Reigning The Nifty 28th October 2011


 Daily Chart


Half Hourly Chart


The breakout on the upside from the neckline is bullish. Strong resistances at 5230-5343-5350 need to be crossed to achieve the target of around 5600.


follow me on twitter http://twitter.com/#!/lucksr

Happy Trading !!
Lakshmi Ramachandran
www.vipreetsafetrading.com

Reigning The Bank Nifty 28th October 2011


 Daily Chart


Bulls yet again giving in to the bears.Levels to be watched are 9323 and 9972 .
OR
are the bulls gathering strength to jump over the neckline?


follow me on twitter http://twitter.com/#!/lucksr

Happy Trading !!
Lakshmi Ramachandran
www.vipreetsafetrading.com

Thursday, October 27, 2011

S&P 500 27th October 2011


 Daily Chart


 The bias is down with a lower high and lower low for the second day in a row.The positive is the close is above the 200 dema once again.You have the bulls on the upper side of 1258 and the bears on the other. Watch the 1258 level for further insight into strength or weakness.

Resistance at 1270 on the green neckline of the bearish head and shoulder pattern.


follow me on twitter http://twitter.com/#!/lucksr

Happy Trading !!
Lakshmi Ramachandran
www.vipreetsafetrading.com

Wednesday, October 26, 2011

S&P500 26th October 2011


 Daily Chart


Resistance at 1258 respected as anticipated.Till 1258 is scaled successfully the danger of the fall resuming looms large.


follow me on twitter http://twitter.com/#!/lucksr

Happy Trading !!
Lakshmi Ramachandran
www.vipreetsafetrading.com

HAPPY DIWALI


Tuesday, October 25, 2011

S&P500 25th October 2011


 Daily Chart


Daily Chart II


Follow up buying on low volumes.The neckline at 1258 should be strong resistance.It is also the 61.8% retracement level of the fall from 1370 to 1075.If crossed successfully then the S&P could target 1330.


follow me on twitter http://twitter.com/#!/lucksr

Happy Trading !!
Lakshmi Ramachandran
www.vipreetsafetrading.com

Reigning The Nifty 25th October 2011


 Daily Chart


The stalemate continues.The pennant formation since the last week points to a continuation of the short term uptrend.The 5 dema has successfully crossed the 20 and 50 dema bullishly. 


Half Hourly Chart


Double top at 5169-5160 or double bottom at 4720-4728? The stalemate continues to puzzle.The pennant shows somepromise of an upward breakout but one can never say till it really does so.A break of 5011-5050 levels will turn the tables on the bulls.


follow me on twitter http://twitter.com/#!/lucksr

Happy Trading !!
Lakshmi Ramachandran
www.vipreetsafetrading.com

Reigning The Bank Nifty 25th October 2011


 Daily Chart


Daily Chart II


A bearish engulfing candle at resistance taking the Bank Nifty below the 50 dema. The break of the rising wedge too points to bearishness.Break of 9492 will bring in more selling.

But the breakout from the falling wedge still  maintained.The previous high of 9972 however needs to be crossed for further bullishness.

Till then trade light.


follow me on twitter http://twitter.com/#!/lucksr

Happy Trading !!
Lakshmi Ramachandran
www.vipreetsafetrading.com

Monday, October 24, 2011

S&P500 24th October 2011


 Weekly Chart


Third week with a higher high and higher low in a row.The breakout from the downtrending channel was maintained , though intra week it had corrected into the channel once again.

Daily Chart


The struggle between the 50 and 200 dema proved to be a bull victory with a close above the 200 dema after more than 6 months.the close also sealed a successful cross of the 3 month range between
1210 - 1230.

Resistance at 1258 will be the next challenge.


follow me on twitter http://twitter.com/#!/lucksr

Happy Trading !!
Lakshmi Ramachandran
www.vipreetsafetrading.com

Reigning The Nifty 24th October 2011


 Weekly Chart


Sideways move continues with the 5169 level getting tough to cross.A lower high at 5160 keeps the bearishness intact.

Daily Chart


The pennant formation raises a few hopes of the short term uptrend continuing. Trade in the direction of breakout.


follow me on twitter http://twitter.com/#!/lucksr

Happy Trading !!
Lakshmi Ramachandran
www.vipreetsafetrading.com

Reigning The Bank Nifty 24th October 2011


 Weekly Chart


 Daily Chart


The sideways move has been intact since September. The positive divergence shown last week may have played out with  the weekly candle  forming a doji signaling lack of commitment by the bulls. The 50 dema has been violated once again.The rising wedge shown on daily charts has been broken down and a retest of the lows would be in order.A lower high at 9865 keeps the bearishness intact.


follow me on twitter http://twitter.com/#!/lucksr

Happy Trading !!
Lakshmi Ramachandran
www.vipreetsafetrading.com

Sunday, October 23, 2011

Cherry Picks and The Gold Rush


Dear Readers,

Thanks for the overwhelming response to my picks.It was a pleasant surprise to me.Just a gentle reminder to the ones who are still attracted but undecided. The Gold Rush is free with the The Cherry Picks subscription till the end of this month, the Diwali month.

For those wondering what this is about please read my posts -

http://vipreetinvestments.blogspot.com/2011/10/calling-greedy.html
http://vipreetinvestments.blogspot.com/2011/10/gold-rush.html

Thanks once again,


follow me on twitter http://twitter.com/#!/lucksr

Happy Trading !!
Lakshmi Ramachandran
www.vipreetsafetrading.com

Friday, October 21, 2011

S&P500 21st October 2011


 Daily Chart


Confusion about the direction led to an expanding triangle.This in turn led to indecision forming an equilateral triangle.It has very nearly formed a diamond  which is a continuation pattern.So looks like a potential double top in the making or a continuation of the short term uptrend?


follow me on twitter http://twitter.com/#!/lucksr

Happy Trading !!
Lakshmi Ramachandran
www.vipreetsafetrading.com

Reigning The Nifty 21st October 2011


 Half Hourly Chart


Double tops at 5169,double bottoms at 4720. An inverse head and shoulder in the making. Bearish and bullish signals, confusion galore.The latest formation is a symmetrical triangle which does not make the position any clearer. 

Wait for the breakout to get direction.


follow me on twitter http://twitter.com/#!/lucksr

Happy Trading !!
Lakshmi Ramachandran
www.vipreetsafetrading.com

Reigning The Bank Nifty 21st October 2011


 Daily Chart


Break out of the redrawn dotted downtrending line maintained. Lower top at 9865 needs to be taken out soon else the  downmove will start again.Key would be breakout from the earlier top of 9972.Till then trade light.
follow me on twitter http://twitter.com/#!/lucksr

Happy Trading !!
Lakshmi Ramachandran
www.vipreetsafetrading.com

Thursday, October 20, 2011

S&P500 20th October 2011


 Daily Chart


An Inside Day pattern indicating the confusion and decision about further direction still continues.Immediate support is at 1191 and Resistance at 1234.


follow me on twitter http://twitter.com/#!/lucksr

Happy Trading !!
Lakshmi Ramachandran
www.vipreetsafetrading.com
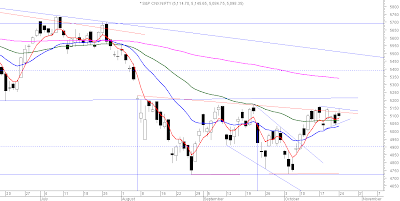
Reigning The Nifty 20th October 2011


 Daily Chart


 Above 50 dema again ! 5169 is the decider though ! Till then keep light.


follow me on twitter http://twitter.com/#!/lucksr

Happy Trading !!
Lakshmi Ramachandran
www.vipreetsafetrading.com

Reigning The Bank Nifty 20th October 2011


 Daily Chart


Break out of the redrawn downtrending line ! But key would be breakout from the earlier top of 9972.Till then trade light.


follow me on twitter http://twitter.com/#!/lucksr

Happy Trading !!
Lakshmi Ramachandran
www.vipreetsafetrading.com

Wednesday, October 19, 2011

S&P500 19th October 2011


 Daily Chart


 A confused market clearly ! A bullish engulfing candle and an Outside Day which may be potential reversal signals.Resistance at 200 dema and Support at 50 dema ! Keep a tight stop at the 50dema for longs.


follow me on twitter http://twitter.com/#!/lucksr

Happy Trading !!
Lakshmi Ramachandran
www.vipreetsafetrading.com

Reigning The Nifty 19th October 2011


 Daily Chart


The Nifty had two choices yesterday - to breakout of 5169 or make a U turn to go down again and Nifty chose to make the U turn. The gao down below the 50 dema is surely bearish and a retest of the 4720 lows seems to be the next step.Unless the Nifty wants to surprise us this time otherwise !

The sideways action has made me lazy. Have been usign the same half hourly chart since about 2 months !


Half Hourly Chart


follow me on twitter http://twitter.com/#!/lucksr

Happy Trading !!
Lakshmi Ramachandran
www.vipreetsafetrading.com

Reigning The Bank Nifty 19th October 2011


 Daily Chart


A hanging man following the doji is bearish. The gap down opening adds to the bearishness. The pattern is also a bearish island reversal. Till the high of 9972 the low of 8626 is not broken decisively the range bound moves will continue to frustrate.


follow me on twitter http://twitter.com/#!/lucksr

Happy Trading !!
Lakshmi Ramachandran
www.vipreetsafetrading.com

Tuesday, October 18, 2011

S&P500 18th October 2011


 Daily Chart


A bearish candle  making a lower high and a lower almost negated the positive efforts by the bulls on Friday. 50 dema still holds keeping hope for the bulls.

Resistance at 1205-1224-1235   Support at  1191-1167-1157.


follow me on twitter http://twitter.com/#!/lucksr

Happy Trading !!
Lakshmi Ramachandran
www.vipreetsafetrading.com

Reigning The Nifty 18th October 2011


 Daily Chart


Resistance at 5169 respected for the second time making a slightly lower low at 5160 than last times 5168.Crossing this resistance will give a 440 point upmove target.Failure will result in a sideways move or a retest of the 4720 lows.

 Resistance at 5169-5232-5353  Support at 5070-5000-4950.


follow me on twitter http://twitter.com/#!/lucksr

Happy Trading !!
Lakshmi Ramachandran
www.vipreetsafetrading.com

Reigning The Bank Nifty 18th October 2011


 Daily Chart


A doji which gapped up today. This leaves one guessing about further direction.The uptrend is intact till now so lets trust the trend ,the friend and keep our longs.

Resistance at 9788-9962  Support at 9666-9518-9347.


follow me on twitter http://twitter.com/#!/lucksr

Happy Trading !!
Lakshmi Ramachandran
www.vipreetsafetrading.com

Monday, October 17, 2011

S&P500 17th October 2011


 Weekly Chart


The downward sloping channel was broken successfully on the upside with a bullish follow up candle to the hammer like pattern of last week.Volumes were just average indicating no "real buying interest". Oscillators too showing strength and moving up after showing positive divergence.This rally will be considered a pullback till crucial resistances of 1356-1370 is crossed. 

Daily Chart


 Good breakout after a small reaction candle which took support at the 50 dema.Resistance now at  1230-1235 needs to be crossed for further bullishness.Support at 1206-1191.


follow me on twitter http://twitter.com/#!/lucksr

Happy Trading !!
Lakshmi Ramachandran
www.vipreetsafetrading.com

Reigning The Nifty 17th October 2011


Weekly Chart


Last week I had pointed out to the potentially  bullish hammer. The hammer has been confirmed by a bullish candle on good volumes.The two month range of 4720 - 5169  needs to be broken for the upward momentum to catch up. Breaking out of the range could give a 440 point move if the strong resistances at  5230-5252-5330-5395 is scaled successfully.


Daily Chart


Three successful days in staying above the 50 dema.The downtrendline from 5700 has also been scaled .As mentioned in the weekly chart analysis the strong resistance area of 5169-5230-5330 needs to be broken for the bullishness to continue.

An outside day pattern was formed .It is also a bullish engulfing pattern. This could also signal a reversal of the short term uptrend.The stochastics is in the overbought area but in a buy mode with it's signal line.This too could spook the bullishness to get into a correction to the rise from 4728.


Half Hourly Chart


The chart speaks for itself.

follow me on twitter http://twitter.com/#!/lucksr

Happy Trading !!
Lakshmi Ramachandran
www.vipreetsafetrading.com

Reigning The Bank Nifty 17th October 2011


 Weekly Chart


Last week's anticipation of a rebound on the upside came true.Support on downtrending channel held for the second week.The bullish candle on better than average volumes promises of some more upsides.


Daily Chart


The daily charts formed an outside day which is a one day reversal pattern.So watch out if the Bank Nifty trades below 9526. Resistance at 9715-9962  and Support at 9482-9320.

follow me on twitter http://twitter.com/#!/lucksr

Happy Trading !!
Lakshmi Ramachandran
www.vipreetsafetrading.com

Sunday, October 16, 2011

The Gold Rush


Rushing in or rushing out ? What are Gold investors and traders thinking today? In these times, confusion is galore in the gold market! Can one get  a clearer picture? YES! Subscribe to "The Gold Rush" , an in depth yet easy on the eye "crash" introduction to the gold markets, turning you into an expert in analyzing the current and future trends of the gold market  put together by  Nishit Vadhavkar of  money-manthan.blogspot.com/ and  me, Lakshmi Ramachandran.


1. Get the "The Gold Rush" at special Diwali discount rates.
2. Get the "The Gold Rush" + subscribe to " Cherry Picks" at additional discount rate.
3. Existing " Cherry Picks"  subscribers get " The Gold Rush" for FREE


Please write to vipreetsubscription@gmail.com for details.


follow me on twitter http://twitter.com/#!/lucksr

Happy Trading !!
Lakshmi Ramachandran
www.vipreetsafetrading.com

Friday, October 14, 2011

S&P500 14th October 2011


 Daily Chart


Power of trendlines proved again. A hanging man at trendline resistance is truly ominous. Maybe in the  third leg down ? Supports at 1190-1165.


follow me on twitter http://twitter.com/#!/lucksr

Happy Trading !!
Lakshmi Ramachandran
www.vipreetsafetrading.com

Reigning The Nifty 14th October 2011


 Daily Chart


 Support taken at the 50 dema.Resistance at 5137-5169-5229.  Support  4997-4944-4920.


follow me on twitter http://twitter.com/#!/lucksr

Happy Trading !!
Lakshmi Ramachandran
www.vipreetsafetrading.com