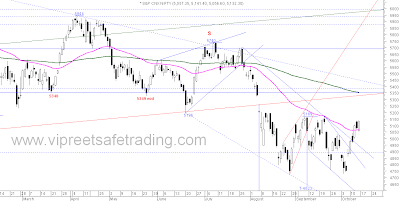
Weekly Chart
Last week I had pointed out to the potentially bullish hammer. The hammer has been confirmed by a bullish candle on good volumes.The two month range of 4720 - 5169 needs to be broken for the upward momentum to catch up. Breaking out of the range could give a 440 point move if the strong resistances at 5230-5252-5330-5395 is scaled successfully.
Daily Chart
Three successful days in staying above the 50 dema.The downtrendline from 5700 has also been scaled .As mentioned in the weekly chart analysis the strong resistance area of 5169-5230-5330 needs to be broken for the bullishness to continue.
An outside day pattern was formed .It is also a bullish engulfing pattern. This could also signal a reversal of the short term uptrend.The stochastics is in the overbought area but in a buy mode with it's signal line.This too could spook the bullishness to get into a correction to the rise from 4728.
Half Hourly Chart
The chart speaks for itself.
follow me on twitter http://twitter.com/#!/lucksr
Happy Trading !!
Lakshmi Ramachandran
www.vipreetsafetrading.com


No comments:
Post a Comment