Om Sri Ganeshaya Namaha

Om  Sri  Ganeshaya  Namaha
follow me on twitter http://twitter.com/#!/lucksr

Sunday, September 27, 2020

Weakness Persists in Bank Nifty


Weekly Chart 


 Daily Chart 


 Hourly Chart


Bank Nifty has already retraced around 55% of the rise from March lows showing bear strength.A fall below the 61.8%  level of 19598 will probabaly lead to make fresh lows.


follow me on twitter http://twitter.com/#!/lucksr 


Happy Trading !! 

Lakshmi Ramachandran

Downtrend confirmed


Weekly Chart 


 Daily Chart 


 Hourly Chart 


The pullback on the last trading day will hit strong resistance in the 11100 to 11200 area as marked in the chart below.

Hourly Chart showing Resistance


follow me on twitter http://twitter.com/#!/lucksr 

Happy Trading !! 

Lakshmi Ramachandran

Saturday, September 19, 2020

Range Bound Markets


Weekly Chart 


 Daily Chart 


Hourly Chart 


Bank Nifty Weekly Chart


Bank Nifty Daily Chart


The sideways move on Nifty could break out either way.Bank Nifty is clearly drifting down within the range. 

 I would continue to be cautious. 


follow me on twitter http://twitter.com/#!/lucksr 


Happy Trading !! 


Lakshmi Ramachandran

Sunday, September 13, 2020

Bank Nifty Confirms Bearishness


Weekly Chart 


 Daily Chart 


follow me on twitter http://twitter.com/#!/lucksr 

Happy Trading !! 

Lakshmi Ramachandran

Lower high Lower low in place


Weekly Chart 


 Daily Chart 


Nifty has recovered 50 % of the fall from 11794 to 11185.A lower high lower low is in place confirming a short term downtrend. Only a close above 11585 will negate this.

 Five Minute Chart 


The correction is within a falling channel as shown on the 5 minute chart.A breakout from the channel will be the first sign of the upmove resuming.


follow me on twitter http://twitter.com/#!/lucksr 

Happy Trading !! 

Lakshmi Ramachandran

Sunday, September 6, 2020

Reigning The Bank Nifty 7th September 2020


Weekly Chart 


A Dark Coud cover is a bearish reversal pattern and the Bank Nifty has formed a classic pattern of the same on the weekly charts.

 Hourly Chart 


Technically bearishness will be confirmed only on a break of the 21028 lows.


follow me on twitter http://twitter.com/#!/lucksr 

Happy Trading !! 

Lakshmi Ramachandran


Nifty could see a reversal


Weekly Chart 


The weekly candle formed a bearish engulfing candle. The pattern indicating a reversal is quite strong as, Nifty has been in an uptrend since almost 24 weeks,
the pattern formed with the bearish candle which totally engulfed the previous bullish candle,
and, the size of the bearish candle was significant. The hourly chart depicts the intensity of the fall.
The oscillators are showing negative divergence.
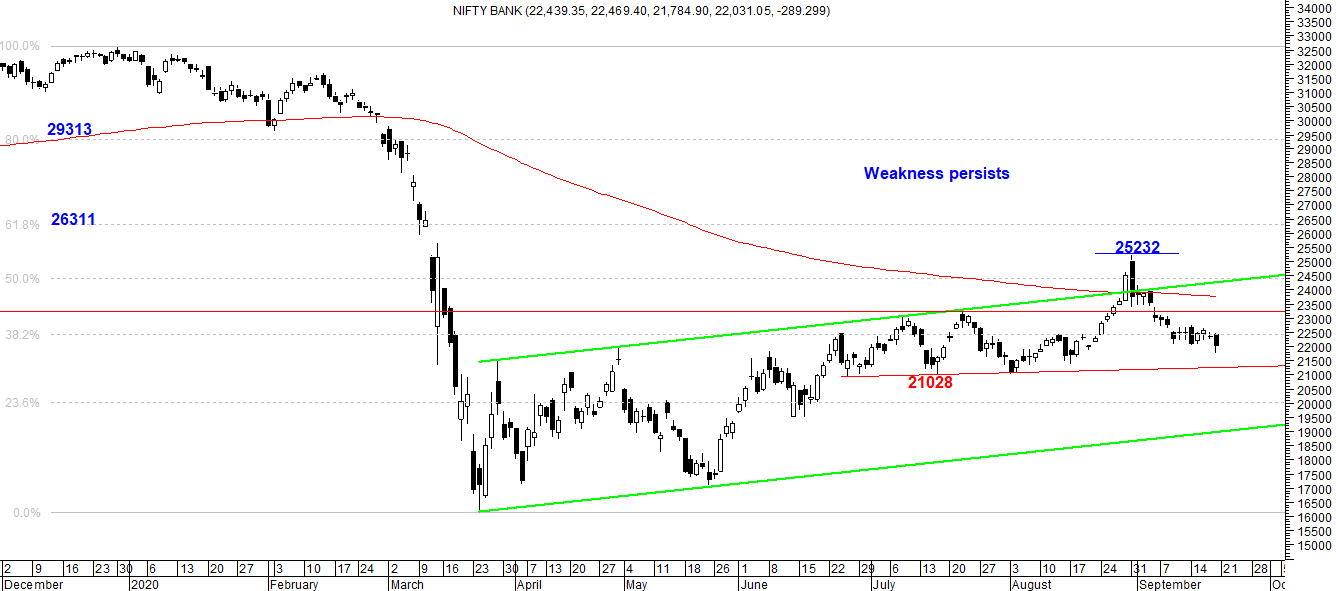
 Daily Chart 


The uptrendline of the upmove from April lows has been broken by the bearish candle and Nifty has failed to close above it since.

 Half Hourly Chart 


Till the gap and lower high of 11585 is not taken out the Nifty remains weak.


follow me on twitter http://twitter.com/#!/lucksr 

Happy Trading !! 

Lakshmi Ramachandran

Tuesday, September 1, 2020

Update 1st September 2020


Monthly Chart 


 Daily Chart 


 Bank Nifty Daily Chart 


We need to see further action to decide futher trades.


follow me on twitter http://twitter.com/#!/lucksr 

Happy Trading !! 

Lakshmi Ramachandran