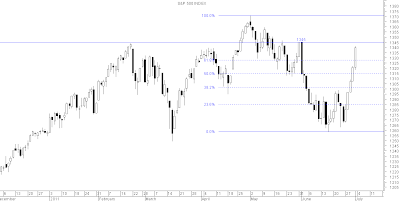
Monthly Chart
Monthly stochastics in sell from the overbought region supporting a correction.Rising wedge support at 1280.
Weekly Chart
The weekly candle was extremely bullish on good volumes. It was the highest close in the last seven weeks.Stochastics has given a buy after reaching the oversold levels indicating the pullback may continue.
Daily Chart
Daily stochastics has reached the overbought level. 1345 may prove good resistance triggering a pullback.
Resistance now at 1345-1365-1392. Support at 1322-1310-1300-1291-1258.Only a fall below 1258 will reverse the trend.
follow me on twitter http://twitter.com/#!/lucksr
Happy Trading !!
Lakshmi Ramachandran
www.vipreetsafetrading.com


No comments:
Post a Comment