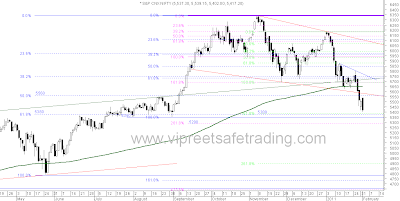
Daily Chart
The triangle target of 5400 was achieved. Today's trade, though bearish, kept getting support around the 5400 level.Around this level are multiple fibonacci supports and previous support zone as visible on the chart. A bearish engulfing pattern at such a multiple support level makes me identify the candle as potentially bullish.As explained in my previous posts the last gasp sellers create a bearish engulfing pattern which usually is followed by increased buying.Watch out for buying oppurtunities with tight stops or hedge the longs as only the follow up candle will confirm the bullishness and there are no other signs of a turn around.
Half Hourly Chart
The sharp falling wedge has resistance at 5470-5401 and support only below 5350. Breakout from the wedge could turn the scene mildly bullish for a decent pullback.
follow me on twitter http://twitter.com/#!/lucksr
Happy Trading !!
Lakshmi Ramachandran
www.vipreetsafetrading.com


No comments:
Post a Comment