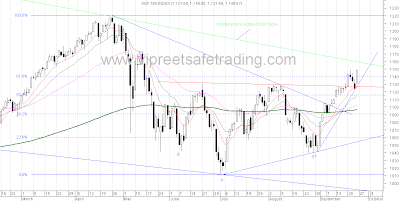
Daily Chart
A bullish candle recovering the entire fall of the last three days. The close too is the highest since the May bottom. A new upward sloping channel has emerged shown in pink.Resistance from this channel is at 1151.
The S&P is really close to a breakout from the downtrendline from October 2007 shown in green.A breakout from this down trendline will be really bullish.Resistance from this trendline is at 1159. Support at 1132 at the uptrendline from 1040.
Resistance at 1151-1159 Support at 1132-1122.
Happy Trading !!
Lakshmi Ramachandran
www.vipreetsafetrading.com


No comments:
Post a Comment