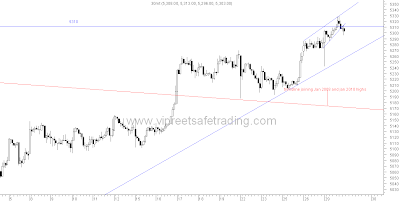
Daily Chart
Half Hourly Chart
- Wide ranging candle ending with a small white body depicting confused markets.
- Previous high of 5310 was crossed intra day, but could not close above it
- Daily and intra day oscillators are in negative divergence.
- Breadth was negative once again driving the advance decline line to new lows.
Happy Trading !!
Lakshmi Ramachandran
www.vipreetsafetrading.com


2 comments:
Thanks for the early updation :)
Is Market is fooling me?? lot of -ve in the TA, but ready to come down :(
Is 50 week SMA crossed 200 week SMA is bullish? as u r in market long time any previous record showing this as bull move? I am using only EOD charts..(seen thro some free chart providers :)donno whether i am right..)
Is this a rally like March ;09 to October ;09??
Thanks and regards
yes 50 cutting 200 in weekly is bullish. also whether this will be like march 09 rally? well, in march the market was down so it had more chances of going up. is it like oct 09? well maybe only time will tell. just follow ur indicator with proper stops/hedges.
Post a Comment