Daily Chart
Half Hourly Chart
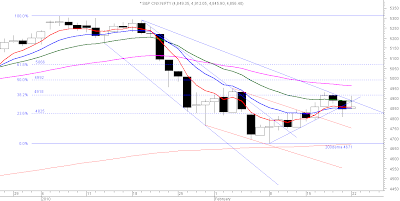
Shooting Star or Inverted Hammer? The Nifty will confirm tomorrow. Being at crossroads makes trading difficult. The shooting star is ominous to the uptrend from 4675 and is the third bearish candle in a row.
The inverted hammer on the other hand could be telling us that today's low is cemented and that the uptrend will continue.Today's candle also made a higher high higher low.
Oscillators on half hourly charts are in neutral territory showing little strength. Daily oscillators too are neutral.
We could fall back on chart patterns to get a clearer picture. The upward channel shown on half hourly charts will keep the Nifty in upward movement. The inverted head and shoulders pattern will keep hopes of upmove till invalidated.
The Nifty failed in it's 4th attempt to scale 4951. This makes it a crucial resistance to be crossed for any sustainable upmove. Supports at 4805-4754-4700.
Hedged longs with a stop as per risk profile should be the strategy. As per risk profile because volatility may increase in the next few days due to budget news flow and Derivatives expiry.
Happy Trading !!
Lakshmi Ramachandran
www.vipreetsafetrading.com


3 comments:
Thank you for the early updation :)
Regards
which are moving averages you have used in the first chart
5,10,20,50
Post a Comment