Monthly Chart
- A doji forming a lower high and lower low on low volumes.
- Oscillators stochastics and Rsi 14 showing negative divergence.
- Moving within an upward channel with support at 4755 for March 2010.
- Maintained above 61.8% retracement level of fall from 6357- 2252.
- A broad range of 780 points between 5310-4538 maintained since last six months. Only a break out of these levels can trigger bullishness or bearishness. Else range bound movements will continue.
Weekly Chart
- Second week of a higher high and higher low.
- Channel maintained. Stop loss at 4740 for the coming week.
- The rise from 4675 has been on increasing volumes.
- Stochastics has given a buy since last week and is moving up.
Daily Chart
Daily Line Chart
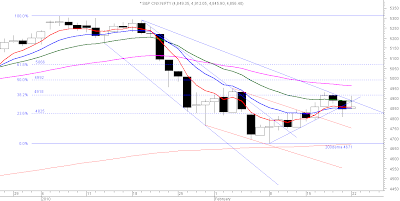
- Range of 4805-4951 was broken only intraday. So the break of this range on a closing basis remains very important .
- The Nifty resisted exactly at the 50% retracement of the fall from 5310 to 4675.
- Close above the 20 dema and the 38.2% fibo level which was proving resistance since last 6 trading sessions.
- The OBV has scaled past resistances of peaks made when Nifty was in this range.
- Breakout from the falling wedge shown on line charts since 22nd Feb maintained with a target which at the moment looks out of the hat-- 5400 as per line charts.
Half Hourly Chart
- Breakout from the inverse head and shoulders giving a target of 5180.
- Channel break target at 5065.
- Oscillators moving down from overbought zone implying we may see a little more downside before moving up again
Yesterday I mentioned , But a break of a trendline/channel, to give direction, should have the proper thrust which this break lacks. I would give more importance to the "range break" . The reading was proved right as markets shot up and out of the 7 day range , closed above the 3 day range and made the highest close in the last 7 days within the range of 4805-4951. We are in the upper part of the range and need to remain cautious till the Nifty closes above 4951 decisively.
WE now have a broad range on the monthly 5310-4538. A break from this range will set the trend once again. Within this range we breathlessly wait for the short term range of 4805-4930 to give us the short term direction.Various price patterns which I have discussed tell us we may be moving up for sometime. So one may trade long for the various targets or remain long with appropriate stops. 4750 would be the stop for longs . If one has read my analysis well they would know why I have chosen this level.
I would prefer to continue my "hedged longs" with a stop loss of 4750.
Happy Trading !!
Lakshmi Ramachandran
www.vipreetsafetrading.com


