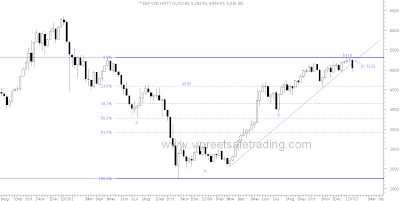
Monthly Chart
- Monthly charts show a sideways movement since October 2009 on low volumes.
- Reisited exactily at 5300 which was earlier resistance shown in green.
- Monthly support level of 4650 shown in red is very crucial to the uptrend.
- The fall in January has been on low volumes.
- Only a monthly close below 4650-4530 will turn the monthly scenario bearish.
Weekly Chart
- Weekly scenario has deteriorated with a lower high lower top candle decisively below the uptrendline.
- Oscillators have weakened further and broken below their November lows , increasing the probability of Nifty breaking it's November lows of 4538.
- The 3 and 10 wema are bearishly aligned. confirming the short term trend as bearish.
- The 50 wema support is at 4571 thus making the support at 4538 strong as well as crucial.
Daily Chart

- Daily trend is bearish with the Nifty trading below the 50 dema since six trading sessions and all short term demas bearishly aligned.
- Oscillators have reached oversold territory which has already led to a recovery from the low made at 4766.
- The recovery could face hurdles at 4900-4975-5038-5105.
- Bullish scenario only if trades above 5105 levels with strength.
- Support taken on the red dashed line since last three trading session. Thus watch out for a close below it to confirm continued bearishness.
- 200 dema support at 4643.
Half Hourly Chart

- Trend decisively down .
- Oversold oscillators with positive divergence led to a recovery on the last trading session but resisted at the 23.6% fibo level of the fall from 5310 to 4766.
- Breakout from falling wedge gives a target of around 5100 which coincides with the 61.8% fibo level.
Till the medium term turn bearish or the short term turns bullish , trade with strict stops/hedges. Till the 61.8% fibo level of the fall is crossed decisively, selling on rallies would be the strategy.
Happy Trading !!
Lakshmi Ramachandran
www.vipreetsafetrading.com


